
Quickchart MCP Server
The Quickchart MCP Server integrates the QuickChart.io service with FlowHunt, enabling AI assistants and clients to generate dynamic charts programmatically. Id...
4 min read
AI
MCP Server
+4
Empower your AI workflows with AntV’s MCP Server—generate, manipulate, and serve stunning charts directly from FlowHunt.
FlowHunt provides an additional security layer between your internal systems and AI tools, giving you granular control over which tools are accessible from your MCP servers. MCP servers hosted in our infrastructure can be seamlessly integrated with FlowHunt's chatbot as well as popular AI platforms like ChatGPT, Claude, and various AI editors.
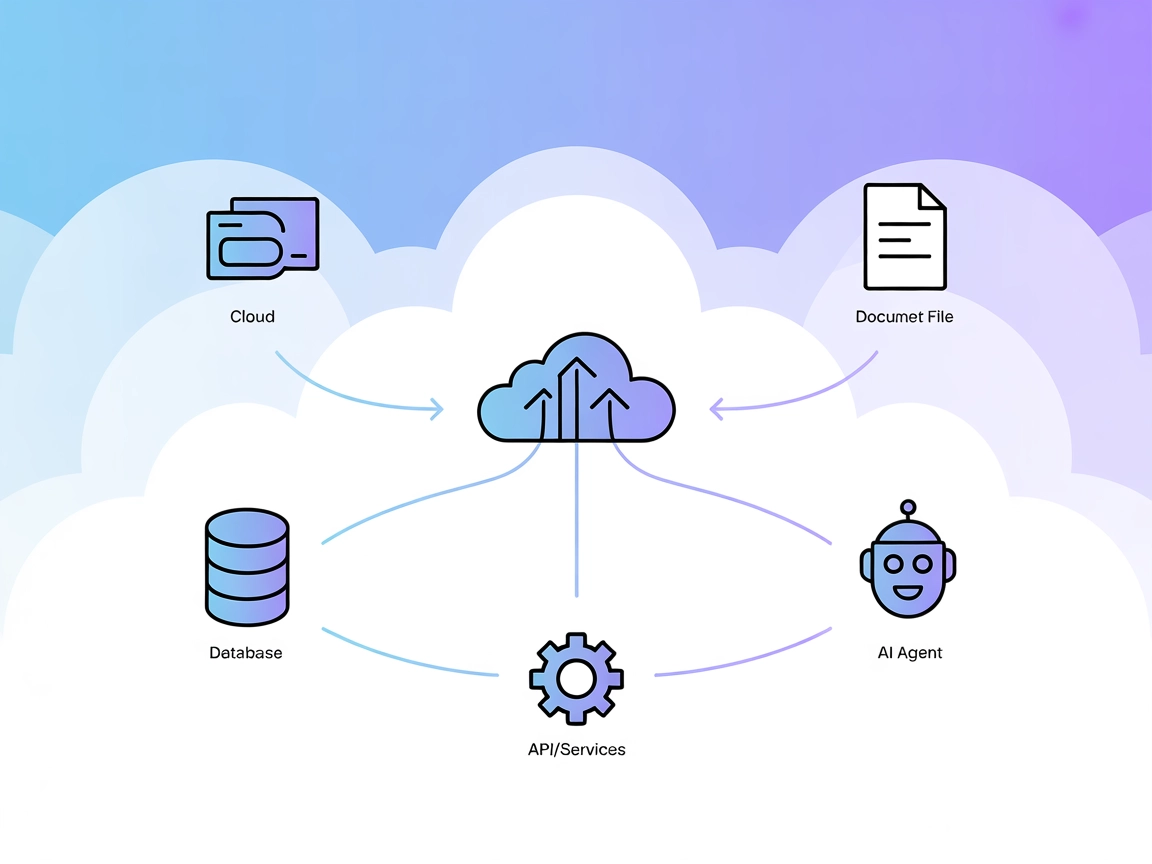
The AntV MCP Server is a visualization Model Context Protocol (MCP) server designed to generate over 25 types of visual charts using the AntV charting library. Acting as a bridge between AI assistants and the powerful charting capabilities of AntV, this MCP server enables AI-driven workflows to create, manipulate, and serve chart visualizations on demand. By exposing chart generation as an MCP tool, it enhances development workflows in applications that require dynamic data visualization, insight presentation, and report generation. The server empowers clients to easily request charts for analytics, dashboards, and business intelligence scenarios, all standardized via the MCP interface.
No information found about prompt templates in the repository.
Start your free trial today and see results within days.
No explicit resources documented in the repository.
Get latest tips, trends, and deals for free.
mcpServers section.{
"mcpServers": {
"antv-chart": {
"command": "npx",
"args": ["@antv/mcp-server-chart@latest"]
}
}
}
mcpServers key:{
"mcpServers": {
"antv-chart": {
"command": "npx",
"args": ["@antv/mcp-server-chart@latest"]
}
}
}
{
  "mcpServers": {
    "antv-chart": {
      "command": "npx",
      "args": ["@antv/mcp-server-chart@latest"]
    }
  }
}
{
  "mcpServers": {
    "antv-chart": {
      "command": "npx",
      "args": ["@antv/mcp-server-chart@latest"]
    }
  }
}
Securing API Keys To secure API keys and sensitive inputs, use environment variables. Example configuration:
{
  "mcpServers": {
    "antv-chart": {
      "command": "npx",
      "args": ["@antv/mcp-server-chart@latest"],
      "env": {
        "API_KEY": "${API_KEY}"
      },
      "inputs": {
        "apiKey": "${API_KEY}"
      }
    }
  }
}
Replace "API_KEY" with your actual environment variable name.
Using MCP in FlowHunt
To integrate MCP servers into your FlowHunt workflow, start by adding the MCP component to your flow and connecting it to your AI agent:
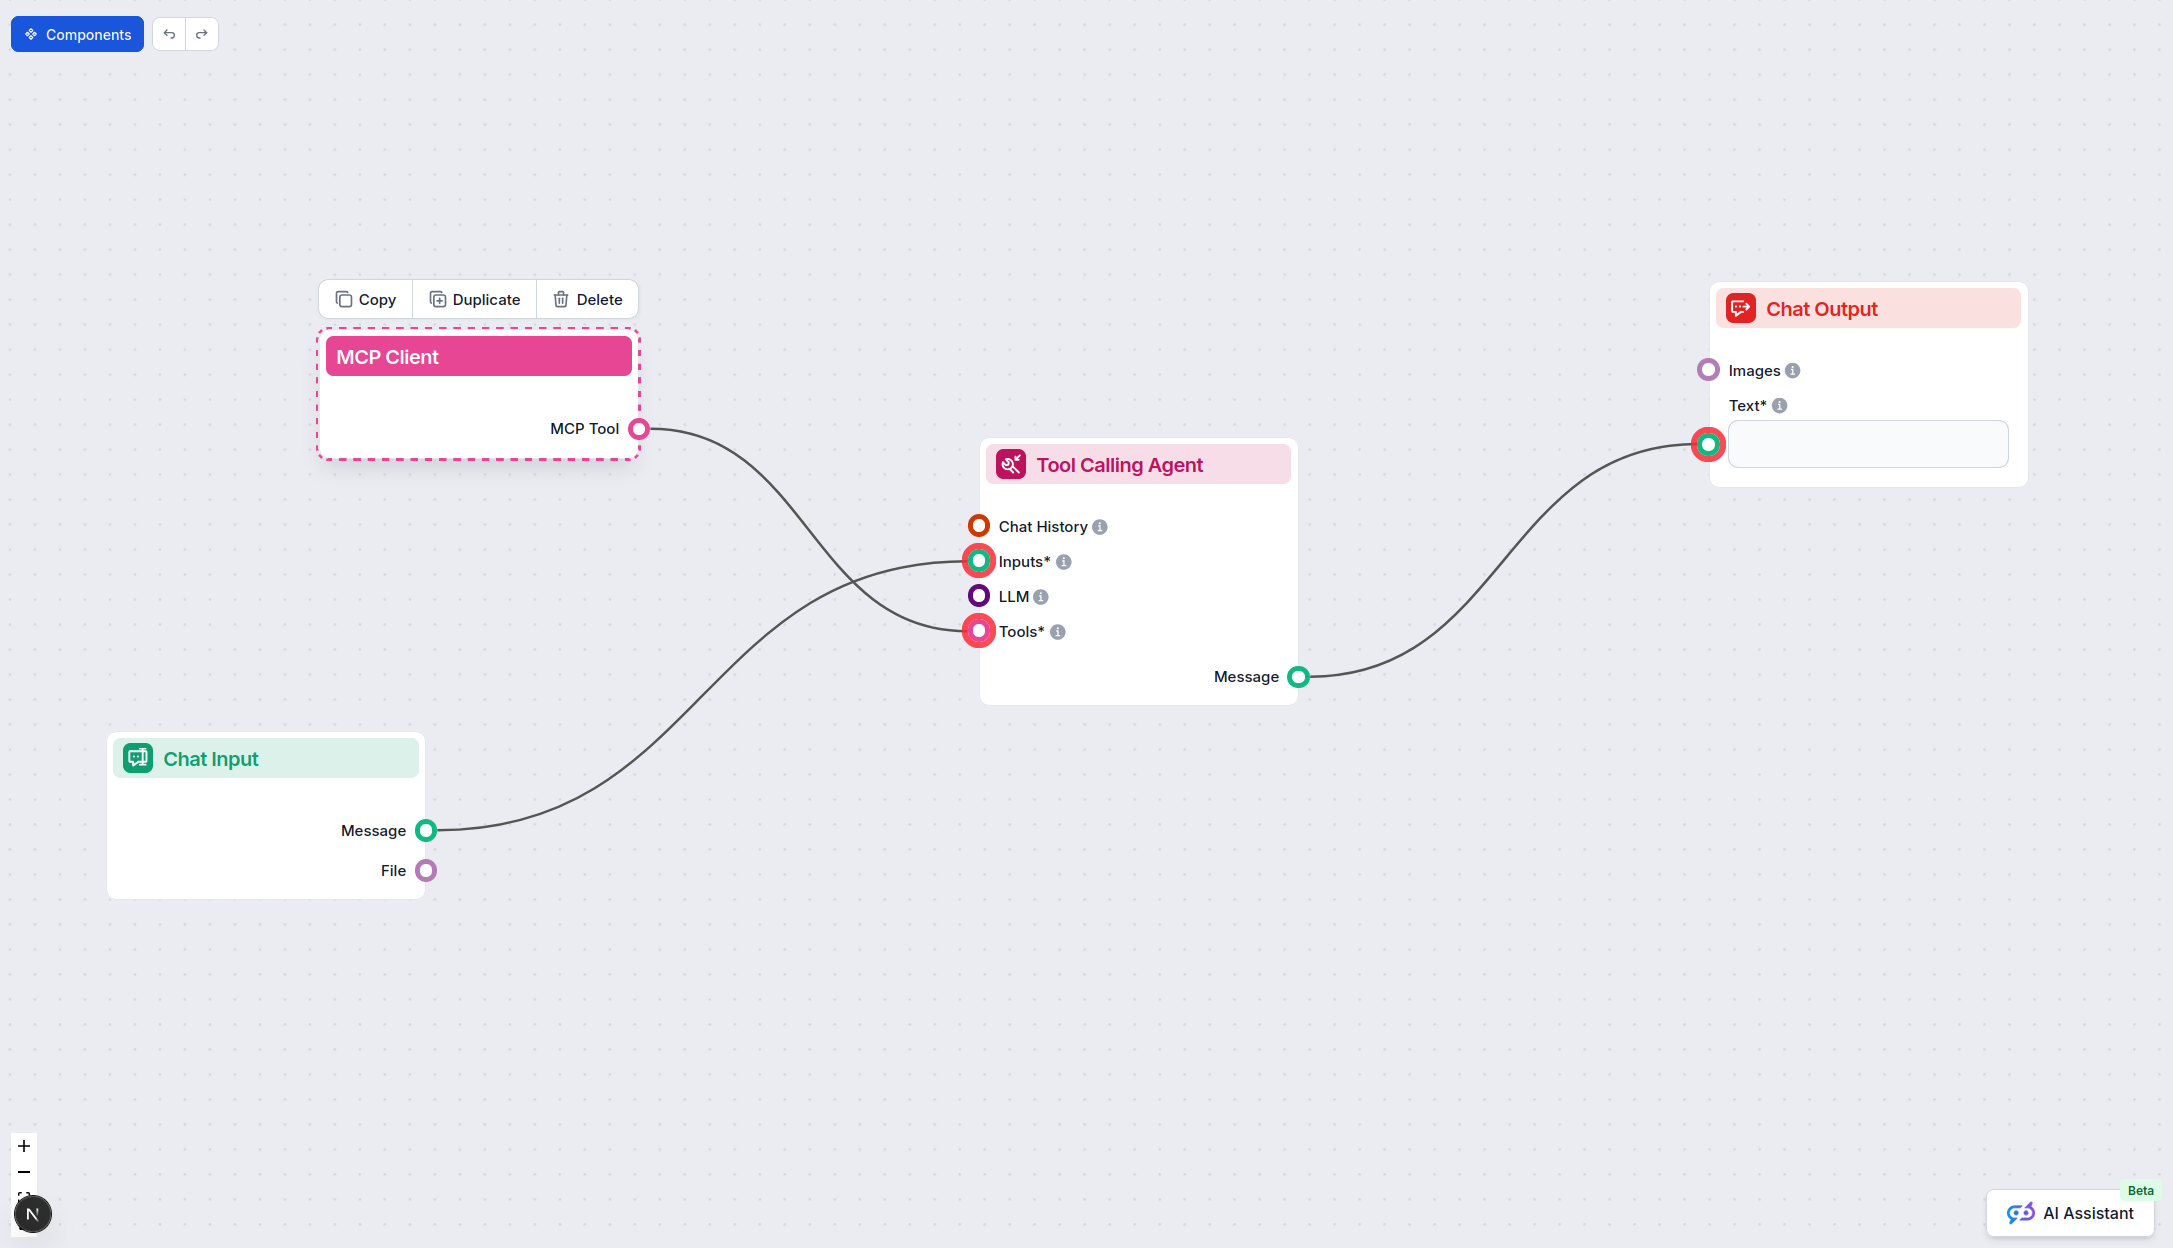
Click on the MCP component to open the configuration panel. In the system MCP configuration section, insert your MCP server details using this JSON format:
{
  "antv-chart": {
    "transport": "streamable_http",
    "url": "https://yourmcpserver.example/pathtothemcp/url"
  }
}
Once configured, the AI agent is now able to use this MCP as a tool with access to all its functions and capabilities. Remember to change “antv-chart” to whatever the actual name of your MCP server is and replace the URL with your own MCP server URL.
| Section | Availability | Details/Notes |
|---|---|---|
| Overview | ✅ | |
| List of Prompts | ⛔ | No prompt templates found |
| List of Resources | ⛔ | No explicit resources found |
| List of Tools | ✅ | Chart generation tool |
| Securing API Keys | ✅ | Env variables shown |
| Sampling Support (less important in evaluation) | ⛔ | Not mentioned |
The AntV MCP Server is highly specialized for chart generation and visualization, offering clear utility for analytics and visual-centric workflows. However, documentation lacks detail on prompt templates, resources, sampling, and roots support. For visualization-centric developers, it is a focused and valuable tool, but broader MCP features are not fully surfaced.
| Has a LICENSE | Yes (MIT) |
|---|---|
| Has at least one tool | Yes |
| Number of Forks | 111 |
| Number of Stars | 1.2k |
The AntV MCP Server is a Model Context Protocol server that enables the generation of over 25 types of visual charts using the AntV charting library. It connects AI assistants and applications to powerful charting tools for data visualization, reporting, and analytics.
The AntV MCP Server supports a wide variety of charts including bar, line, pie, and many others—over 25 types in total—making it suitable for dashboards, analytics, and business intelligence.
Add an MCP component to your FlowHunt flow, then configure it with your AntV MCP server details in the system MCP configuration section using the provided JSON format. This enables your AI agents to request charts programmatically.
Yes. Use environment variables to store and inject sensitive values like API keys. Configure the MCP server with the environment variable and reference it in your MCP server settings for enhanced security.
The AntV MCP Server can be used for automated data visualization, business intelligence integration, dynamic report generation, educational platforms, and providing visualization support for AI assistants.
Elevate your analytics and reporting with dynamic chart generation. Connect the AntV MCP Server to FlowHunt and unlock powerful visualization capabilities.
The Quickchart MCP Server integrates the QuickChart.io service with FlowHunt, enabling AI assistants and clients to generate dynamic charts programmatically. Id...
The Model Context Protocol (MCP) Server bridges AI assistants with external data sources, APIs, and services, enabling streamlined integration of complex workfl...

Visio MCP Server enables programmatic creation and editing of Microsoft Visio diagrams via a standardized API. Integrate Visio automation into your AI workflows...
Cookie Consent
We use cookies to enhance your browsing experience and analyze our traffic. See our privacy policy.