
Gravitino MCP Server Integration
The Gravitino MCP Server bridges AI assistants with Apache Gravitino, enabling seamless metadata management, catalog discovery, and workflow automation through ...
4 min read
AI
MCP
+4

The Grafana MCP Server empowers AI assistants with real-time access to Grafana dashboards, datasources, and Prometheus queries—streamlining observability and DevOps workflows inside FlowHunt.
FlowHunt provides an additional security layer between your internal systems and AI tools, giving you granular control over which tools are accessible from your MCP servers. MCP servers hosted in our infrastructure can be seamlessly integrated with FlowHunt's chatbot as well as popular AI platforms like ChatGPT, Claude, and various AI editors.
The Grafana MCP (Model Context Protocol) Server is an integration layer that connects AI assistants with Grafana, enabling enhanced access to dashboards, data sources, and monitoring tools within the Grafana ecosystem. By exposing Grafana’s capabilities via MCP, the server allows AI-powered clients to perform tasks such as searching for dashboards, retrieving detailed dashboard information, managing dashboards, accessing and querying datasources, and executing Prometheus queries programmatically. This streamlines development and operational workflows by allowing AI assistants to interact directly with observability data, automate dashboard management, and facilitate real-time monitoring and troubleshooting, all within the context of AI-driven development environments.
No explicit prompt templates are mentioned in the provided files or documentation.
Start your free trial today and see results within days.
Get latest tips, trends, and deals for free.
windsurf.config.json).{
"mcpServers": {
"grafana-mcp": {
"command": "npx",
"args": ["@grafana/mcp-grafana@latest"]
}
}
}
{
"mcpServers": {
"grafana-mcp": {
"command": "npx",
"args": ["@grafana/mcp-grafana@latest"],
"env": {
"GRAFANA_API_KEY": "${GRAFANA_API_KEY}"
},
"inputs": {
"grafana_url": "https://your-grafana-instance"
}
}
}
}
{
  "mcpServers": {
    "grafana-mcp": {
      "command": "npx",
      "args": ["@grafana/mcp-grafana@latest"]
    }
  }
}
cursor.config.json file.{
"mcpServers": {
"grafana-mcp": {
"command": "npx",
"args": ["@grafana/mcp-grafana@latest"]
}
}
}
{
"mcpServers": {
"grafana-mcp": {
"command": "npx",
"args": ["@grafana/mcp-grafana@latest"]
}
}
}
{
  "mcpServers": {
    "grafana-mcp": {
      "command": "npx",
      "args": ["@grafana/mcp-grafana@latest"],
      "env": {
        "GRAFANA_API_KEY": "${GRAFANA_API_KEY}"
      },
      "inputs": {
        "grafana_url": "https://your-grafana-instance"
      }
    }
  }
}
Using MCP in FlowHunt
To integrate MCP servers into your FlowHunt workflow, start by adding the MCP component to your flow and connecting it to your AI agent:
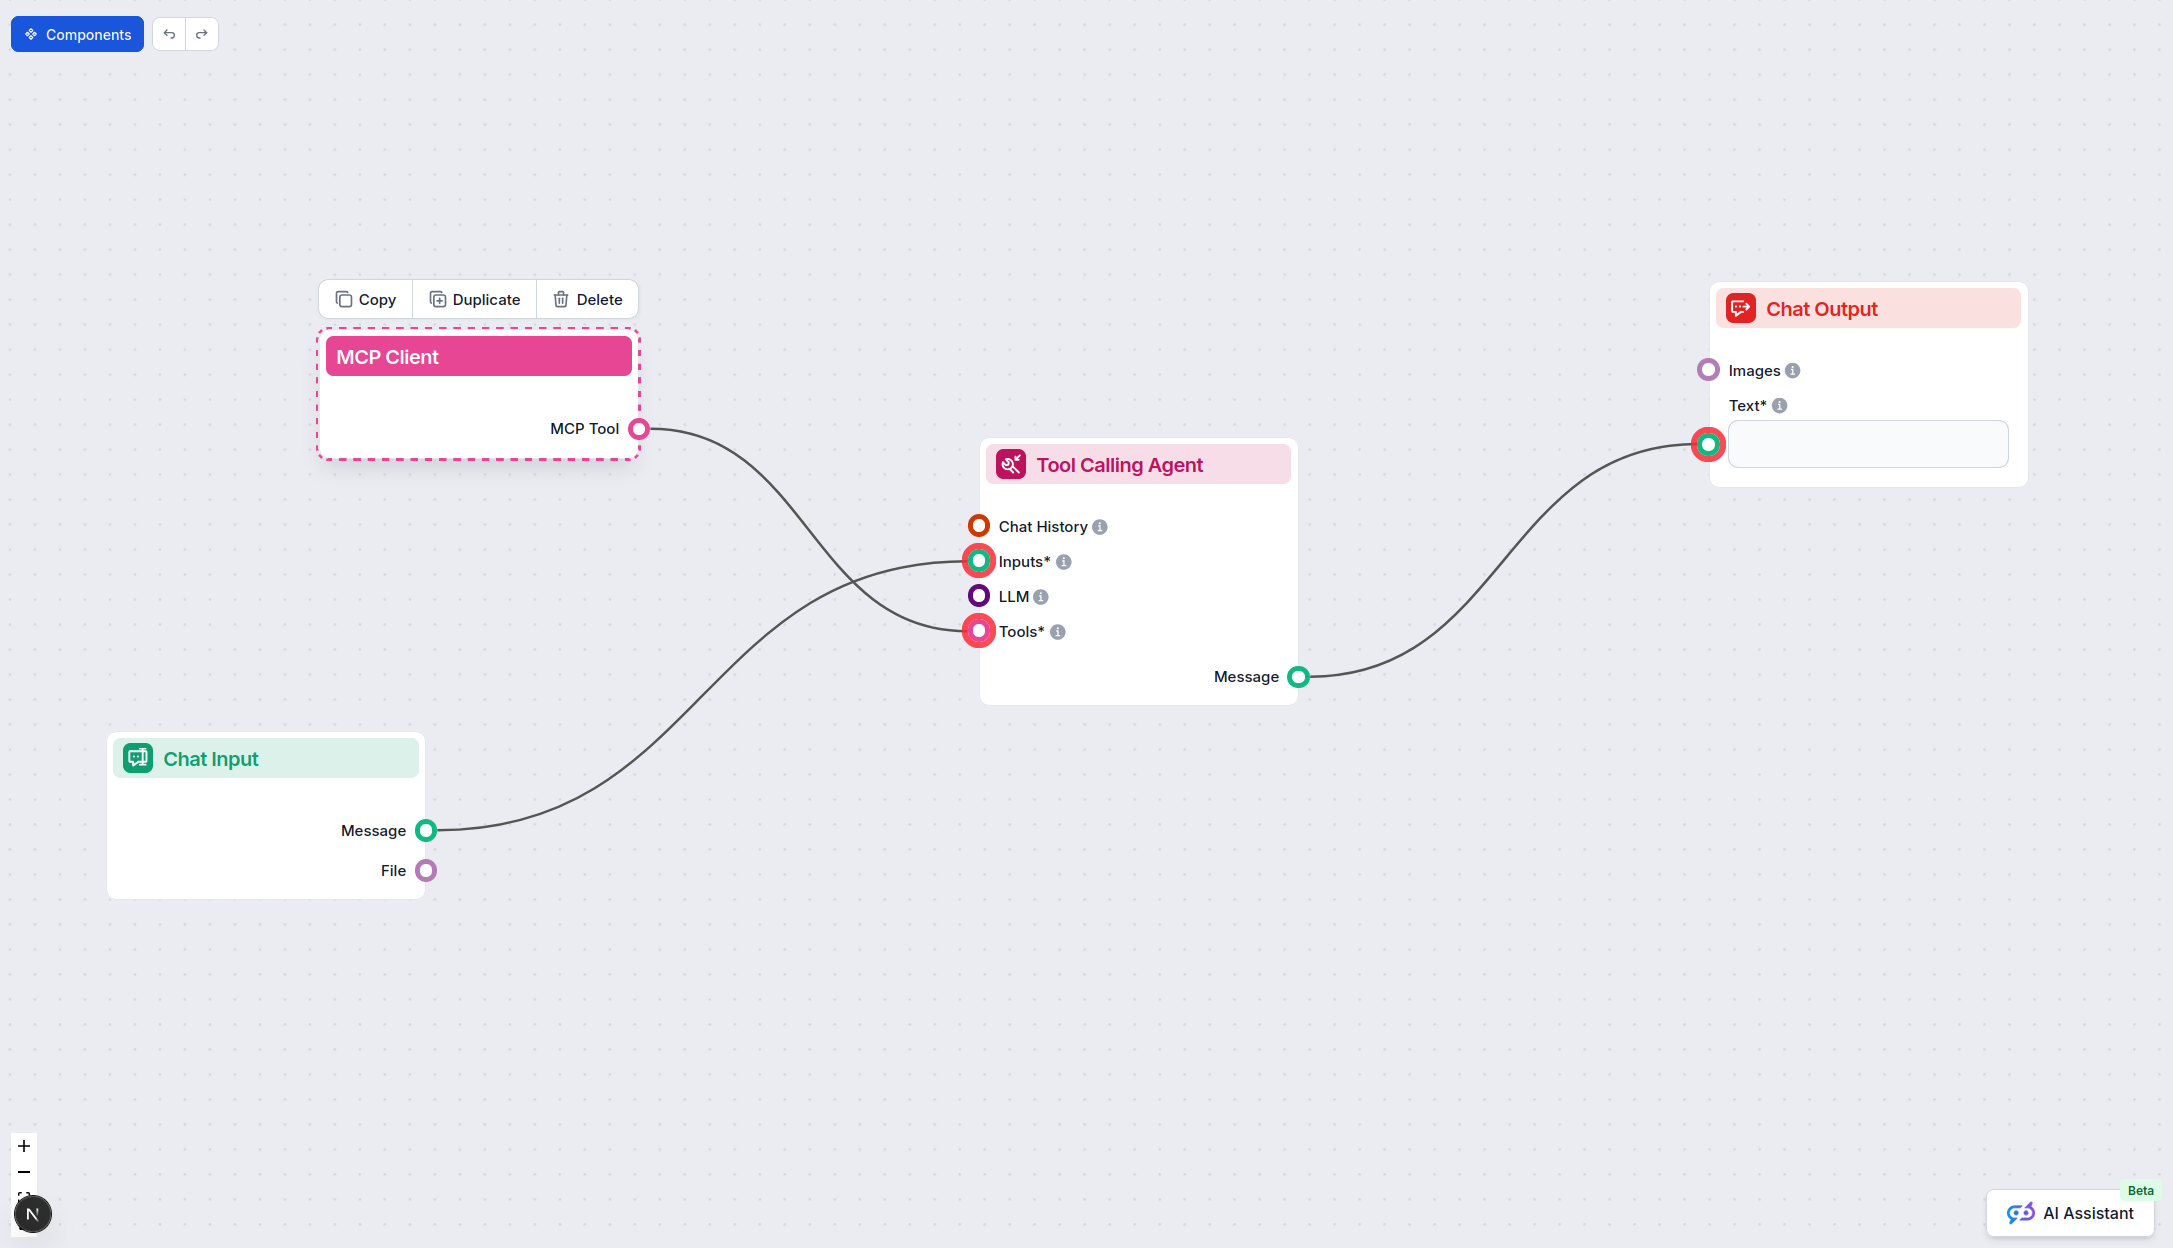
Click on the MCP component to open the configuration panel. In the system MCP configuration section, insert your MCP server details using this JSON format:
{
  "grafana-mcp": {
    "transport": "streamable_http",
    "url": "https://yourmcpserver.example/pathtothemcp/url"
  }
}
Once configured, the AI agent is now able to use this MCP as a tool with access to all its functions and capabilities. Remember to change “grafana-mcp” to whatever the actual name of your MCP server is and replace the URL with your own MCP server URL.
| Section | Availability | Details/Notes |
|---|---|---|
| Overview | ✅ | |
| List of Prompts | ⛔ | No prompt templates mentioned in repo/files |
| List of Resources | ✅ | Dashboards, Datasources, Panel Queries, Prometheus |
| List of Tools | ✅ | Dashboard search, update, datasource, query tools |
| Securing API Keys | ✅ | Example configs for env vars provided |
| Sampling Support (less important in evaluation) | ⛔ | Not mentioned |
Based on the above, the Grafana MCP server is well-documented for setup and covers the core MCP primitives (resources, tools, API key security), but lacks explicit prompt templates and information about sampling support. It is a strong, practical project for Grafana users and developers.
| Has a LICENSE | ✅ Apache-2.0 |
|---|---|
| Has at least one tool | ✅ |
| Number of Forks | 82 |
| Number of Stars | 951 |
The Grafana MCP Server is an integration layer that connects AI assistants to Grafana, enabling programmatic access to dashboards, datasources, and Prometheus querying. It empowers AI-driven automation for monitoring, troubleshooting, and observability inside FlowHunt.
AI assistants can search, retrieve, create, and update dashboards, list and analyze datasources (like Prometheus and Loki), extract panel queries, and execute Prometheus queries—all programmatically within your workflow.
Add the MCP component to your FlowHunt flow, then insert your Grafana MCP server details using the streamable_http transport and your server URL. Make sure to secure your API keys using environment variables as shown in the setup instructions.
Yes, as long as you store your API key in environment variables and never hardcode it into configuration files. Example configs are provided to help you secure sensitive information.
Common use cases include automated dashboard management, datasource exploration, panel query extraction, running Prometheus queries for monitoring/alerting, and integrating observability into DevOps and CI/CD pipelines with AI assistance.
Leverage AI to automate dashboard management and monitoring by integrating Grafana with FlowHunt’s MCP Server. Experience seamless, intelligent observability today.
The Gravitino MCP Server bridges AI assistants with Apache Gravitino, enabling seamless metadata management, catalog discovery, and workflow automation through ...

The Grafbase MCP Server bridges AI assistants and external data sources or APIs, enabling LLMs to access real-time data, automate workflows, and extend capabili...
The Model Context Protocol (MCP) Server bridges AI assistants with external data sources, APIs, and services, enabling streamlined integration of complex workfl...
Cookie Consent
We use cookies to enhance your browsing experience and analyze our traffic. See our privacy policy.