Adjusted R-squared
Adjusted R-squared is a statistical measure used to evaluate the goodness of fit of a regression model, accounting for the number of predictors to avoid overfit...
4 min read
Statistics
Regression
+3
Adjusted R-squared is a statistical measure used to evaluate the goodness of fit of a regression model, accounting for the number of predictors to avoid overfit...
Benchmarking of AI models is the systematic evaluation and comparison of artificial intelligence models using standardized datasets, tasks, and performance metr...
A confusion matrix is a machine learning tool for evaluating the performance of classification models, detailing true/false positives and negatives to provide i...
Cross-validation is a statistical method used to evaluate and compare machine learning models by partitioning data into training and validation sets multiple ti...
Explore the world of AI agent models with a comprehensive analysis of 20 cutting-edge systems. Discover how they think, reason, and perform in various tasks, an...
The F-Score, also known as the F-Measure or F1 Score, is a statistical metric used to evaluate the accuracy of a test or model, particularly in binary classific...
Generalization error measures how well a machine learning model predicts unseen data, balancing bias and variance to ensure robust and reliable AI applications....
A learning curve in artificial intelligence is a graphical representation illustrating the relationship between a model’s learning performance and variables lik...
Log loss, or logarithmic/cross-entropy loss, is a key metric to evaluate machine learning model performance—especially for binary classification—by measuring th...
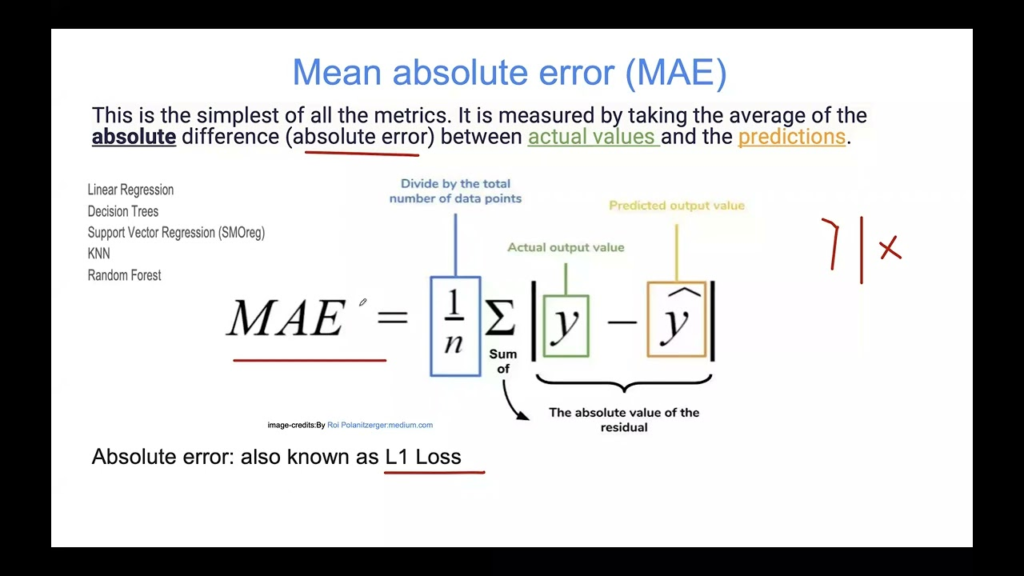
Mean Absolute Error (MAE) is a fundamental metric in machine learning for evaluating regression models. It measures the average magnitude of errors in predictio...
Mean Average Precision (mAP) is a key metric in computer vision for evaluating object detection models, capturing both detection and localization accuracy with ...
Explore our in-depth Gemini 2.0 Thinking performance review covering content generation, calculations, summarization, and more—highlighting strengths, limitatio...
A Receiver Operating Characteristic (ROC) curve is a graphical representation used to assess the performance of a binary classifier system as its discrimination...
Training error in AI and machine learning is the discrepancy between a model’s predicted and actual outputs during training. It's a key metric for evaluating mo...