
Introduction Copilot in Word
A clear overview of the key capabilities Copilot brings into Microsoft Word to help you draft, analyse, and refine content.
4 min read
Beginner
Copilot
+1
A practical example of how to use Copilot in Word to summarise, refine, and analyse reports.
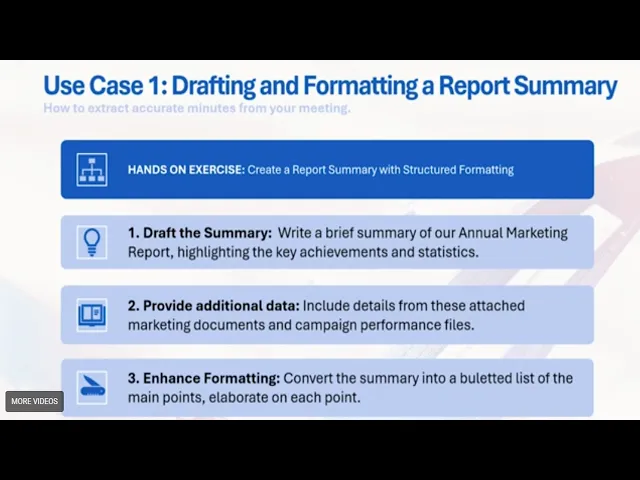
Writing and formatting reports is something almost everyone has to do at work. Copilot in Word makes this process significantly faster by helping with drafting, summarising, refining, and analysing information without leaving your document. In this use case, we look at how Copilot can turn a long report into a structured summary, a formatted email, a set of bullet points, or even a table of insights.
Here are the three key points:

Read more AI Academy stories:
https://www.flowhunt.io/academy/
We begin by opening Word and using Copilot to summarise a 2025 annual marketing report.
To start, we ask Copilot:
Write a brief summary of our 2025 annual marketing report highlighting key achievements and statistics.
Before generating the summary, we use Add content to upload the marketing report from our computer or OneDrive. After pressing Create, Copilot produces a clear overview of the full document.
The first summary included:
However, this was too general. It lacked detail about how each quarter performed.
To improve the summary, we ask Copilot:
Please make it more detailed. Write about each quarter separately.
This time, Copilot generates a structured quarter by quarter breakdown, including campaigns, traffic increases, customer acquisition, engagement metrics, and conversion rates.
For example, Quarter 1 included:
This format reveals how performance evolved over the year and gives a clearer timeline.
Start your free trial today and see results within days.
Next, we ask for a shorter, bulleted overview:
Create a short summary of this using bullet points.
Copilot produces a concise version of the report, highlighting only the most important data points. This is ideal for presentations, internal updates, or quick briefings.
If we want the bullet points placed directly into the document, it is better to use the inline Copilot button instead of the sidebar.
We can also ask Copilot to turn our summary into an email to share with colleagues.
For example:
Turn this into an email congratulating the team.
Copilot rewrites the text into a polished, ready to send message, making it easy to distribute updates from long reports.
Get latest tips, trends, and deals for free.
In the second part of the use case, we explore how to transform report numbers into tables or insights without inserting anything immediately into the document.
For example, we ask:
Make this into a clean two column table with quarter and revenue as headings.
The sidebar reads the document and generates:

We can also push Copilot further by asking for interpretation and reasoning:
What was the percentage increase in revenue from quarter one to quarter four, and is there a chance this increase will continue? Explain why yes and why not.
Copilot provides:
Reasons it may continue include:
Reasons it may not continue include:
If needed, we can insert the full answer into the document for easier reading.
The sidebar also works as a Q&A tool for your document.
We can ask:
Where can I see how much was spent this year?
What was the most expensive item in quarter two?
As long as the answer exists somewhere in the document, Copilot will find it and provide it.
This eliminates endless scrolling and lets you go straight to the information you need.
Copilot in Word does more than draft and summarise. It can:
If you want to fully understand Copilot and use it effectively across Microsoft 365, explore our Microsoft 365 Copilot Essentials training programme:
https://www.flowhunt.io/services/ai-training/microsoft-365-copilot-essentials/
We help companies like yours to develop smart chatbots, MCP Servers, AI tools or other types of AI automation to replace human in repetitive tasks in your organization.
A clear overview of the key capabilities Copilot brings into Microsoft Word to help you draft, analyse, and refine content.

Learn how to use Microsoft Copilot in Word to instantly rewrite, summarize, or enhance internal company documents like policies, handbooks, or memos — all from ...
Learn how to use Microsoft Copilot in Word to instantly rewrite, summarize, or enhance internal company documents like policies, handbooks, or memos — all from ...
Cookie Consent
We use cookies to enhance your browsing experience and analyze our traffic. See our privacy policy.