
Jupyter Notebook
Jupyter Notebook is an open-source web application enabling users to create and share documents with live code, equations, visualizations, and narrative text. W...
4 min read
Jupyter Notebook
Data Science
+5
Plotly is an advanced open-source graphing library for creating interactive, publication-quality graphs online. Compatible with Python, R, and JavaScript, Plotly empowers users to deliver complex data visualizations and supports a wide range of chart types, interactivity, and web app integration.
Plotly is an advanced open-source graphing library that empowers users to create interactive, publication-quality graphs online. It is a prominent tool in the field of data visualization and storytelling, offering an accessible platform to create complex visualizations with ease. Plotly is compatible with multiple programming languages, including Python, R, and JavaScript, making it a versatile choice for a diverse range of users. The library was developed by Plotly Inc., a Canadian computing company based in Montreal, Quebec.
Plotly is celebrated for its extensive capability to produce a broad variety of charts, ranging from line plots, bar charts, scatter plots, to intricate 3D graphs. Built on top of the Plotly.js JavaScript library, Plotly for Python (commonly referred to as Plotly.py) facilitates the creation of interactive web-based visualizations. These visualizations can be displayed in Jupyter notebooks, saved to standalone HTML files, or integrated into web applications using Dash, Plotly’s web application framework.
Plotly can be installed using Python’s package manager, pip, with the command:
pip install plotly
Alternatively, it can be installed using conda:
conda install -c plotly plotly
For use in JupyterLab, additional packages like jupyterlab and ipywidgets may be required to ensure full functionality.
Start your free trial today and see results within days.
To create a simple bar chart in Python using Plotly, the following code can be utilized:
import plotly.express as px

fig = px.bar(x=["a", "b", "c"], y=[1, 3, 2])
fig.show()
This code snippet leverages Plotly Express, a high-level interface designed for creating rich visualizations swiftly.
For more detailed visualizations, Plotly’s graph_objects module offers extensive customization of figures, including layout and design tweaks.
import plotly.graph_objects as go

fig = go.Figure(data=[go.Scatter(x=[1, 2, 3], y=[4, 5, 6])])
fig.update_layout(title='Scatter Plot Example')
fig.show()
Get latest tips, trends, and deals for free.
Dash is Plotly’s open-source Python framework designed for building analytical web applications. It integrates seamlessly with Plotly.py and allows the incorporation of complex UI elements like graphs, dropdowns, and sliders directly with Python analytical code. Dash Enterprise is a premium version offering scalable hosting and deployment features.
To create a basic Dash application, Dash can be installed using pip:
pip install dash
Here is a simple Dash app example:
import dash
from dash import dcc, html

app = dash.Dash(__name__)

app.layout = html.Div([
    dcc.Graph(figure=fig)
])

if __name__ == '__main__':
    app.run_server(debug=True)
This application will render the previously created Plotly figure in a web browser.
Plotly is a powerful tool for anyone interested in creating interactive data visualizations. Its cross-language support, extensive charting capabilities, and seamless integration with web applications via Dash make it an essential library for data scientists, analysts, and developers. Whether engaged in scientific research, financial analysis, or business intelligence, Plotly provides the necessary tools to transform complex data into compelling visual stories.
Discover the power of Plotly to build engaging, publication-quality graphs and dashboards. Try FlowHunt’s tools to accelerate your data visualization journey.
Jupyter Notebook is an open-source web application enabling users to create and share documents with live code, equations, visualizations, and narrative text. W...
Dash is an open-source Python framework by Plotly for building interactive data visualization applications and dashboards, combining Flask, React.js, and Plotly...
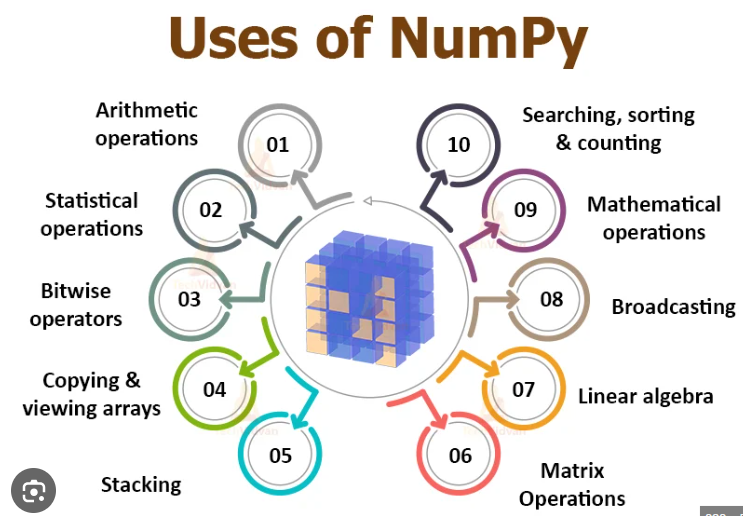
NumPy is an open-source Python library crucial for numerical computing, providing efficient array operations and mathematical functions. It underpins scientific...
Cookie Consent
We use cookies to enhance your browsing experience and analyze our traffic. See our privacy policy.