
A real estate investor used to spend 15 hours every week researching properties, comparing prices, and tracking market shifts across multiple target areas. Real estate AI automation tools cut that to under 2 hours. Here’s the exact setup, what it changes, and what stays the same.
The Problem: Property Research Doesn’t Scale Manually
Property investing is a research-intensive activity. Before any acquisition decision comes a stack of prerequisites, for example understanding current pricing in the target area, identifying whether prices are rising or falling or spotting properties that appear undervalued relative to their attributes, and much more.
None of that is hard in principle. The problem is volume. An investor tracking three or four geographic markets, running multiple deal screenings per month, and monitoring market conditions on an ongoing basis is dealing with a research workload that grows and sooner or later becomes unsustainable. What’s worse, the work itself is repetitive, it’s always the same data collection, normalization, and comparison steps repeated across different areas and time periods.
Manual research doesn’t compound. Every hour spent this week means the same output as the same hour spent last week. There’s no learning curve that makes the fifth market analysis faster than the first.
What 15 Hours of Weekly Research Actually Looks Like
Breaking down a typical week of manual property research makes the time cost visible:
Listing platform review (4–5 hours): Opening multiple platforms for each target area, applying filters, scrolling through results, and identifying listings worth noting. Each platform shows listings differently, and cross-platform comparison requires working through them separately.
Data capture and normalization (3–4 hours): Copying relevant listing data into a spreadsheet, and then standardizing it so the data is actually comparable. Prices come in different formats, property sizes are listed in different units, amenity descriptions vary. None of it comes pre-normalized.
Analysis and comparison (3–4 hours): Building the comparisons, median prices by property type, price-per-square-metre distribution, which listings appear underpriced, how current prices compare to the previous month.
Market monitoring (2–3 hours): Checking for news, planning applications, infrastructure announcements, or market commentary that might affect target areas. This is diffuse and hard to systematize manually.
The 15-hour estimate is conservative. Investors tracking more markets, running more frequent checks, or working across international markets where listing platforms differ can easily exceed it.
Ready to grow your business?
Start your free trial today and see results within days.
How AI Changes the Research Economics
The fundamental shift with real estate investor AI tools is that the repetitive, time-intensive steps, such as data collection, filtering, normalization, and pattern detection, are no longer manual. They happen automatically as part of a single workflow.
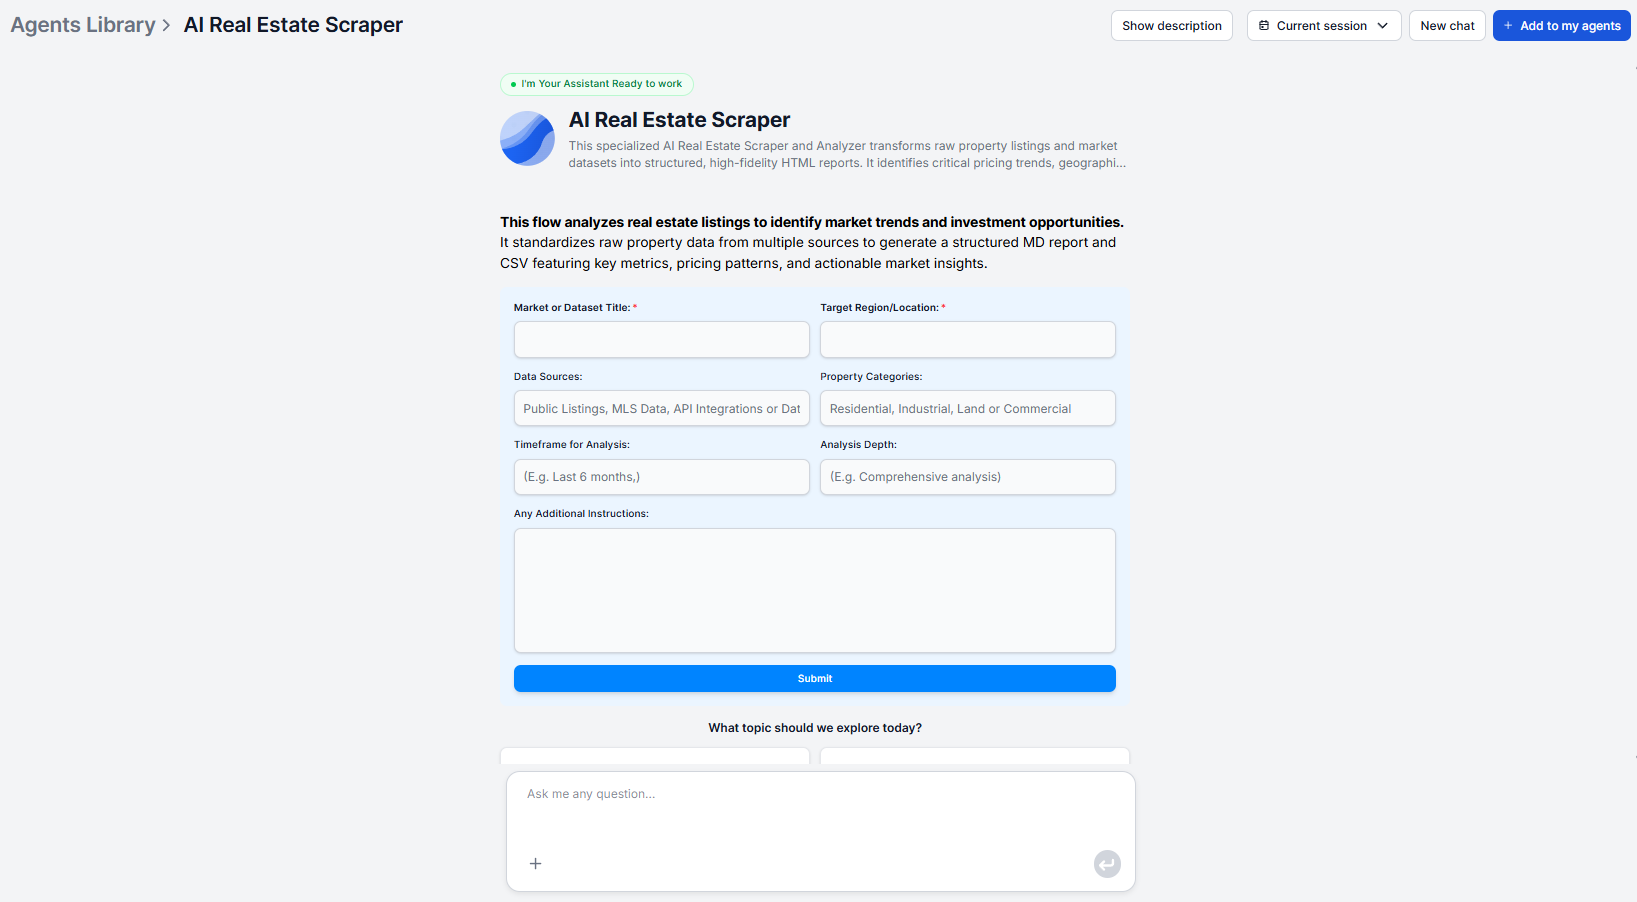
When an investor runs the AI real estate scraper against a target market, the tool queries credible online platforms and APIs simultaneously, aggregates listings across the defined scope, standardizes the data, filters out duplicates and incomplete records, detects patterns, and delivers a structured report.
The Automated Property Intelligence Workflow
The workflow itself is straightforward. The investor defines the target markets they want to track — for example, “residential apartments in Lisbon city center” or “single-family homes under €400,000 in Munich suburbs”, and runs an analysis on each.
The tool handles four stages automatically:
Data collection: Aggregates listings from credible online platforms within the specified scope, ensuring coverage across multiple sources rather than a single platform’s inventory.
Data cleaning and structuring: Standardizes price formats, maps property types to consistent categories, aligns size and amenity data, and removes incomplete, duplicate, or unreliable entries.
Pattern detection: Analyzes the cleaned dataset for pricing distributions, availability trends, and correlations between property attributes and price. Identifies which areas appear undervalued relative to comparable locations and which properties sit outside the expected price range for their attribute profile.
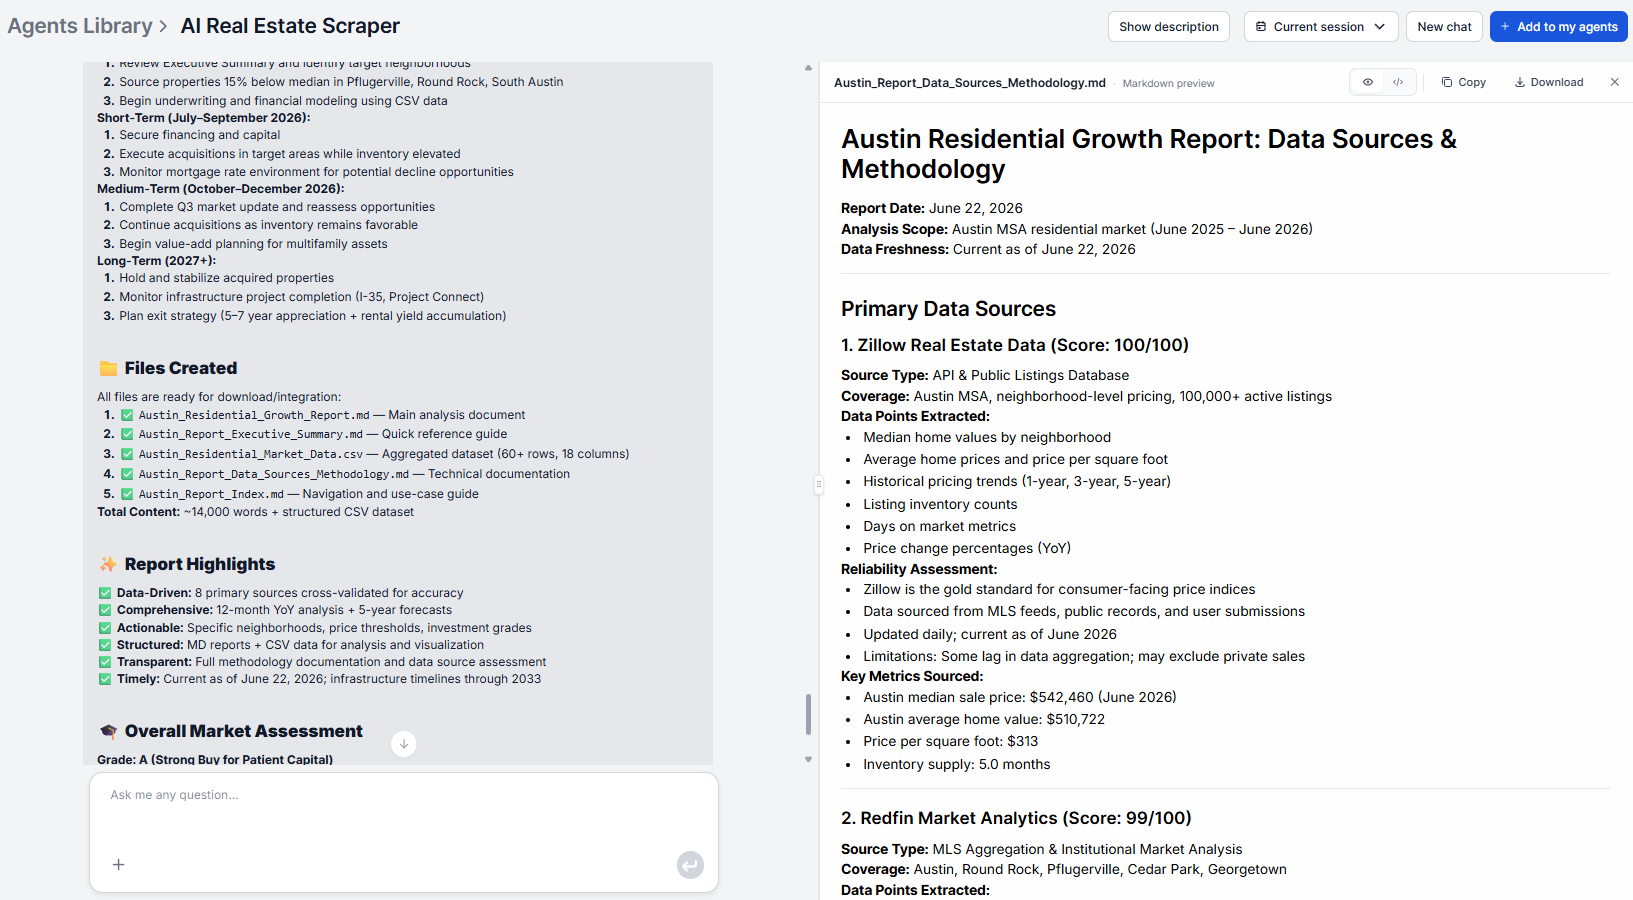
Report generation: Synthesizes findings into a structured report covering a dataset overview, key metrics (average prices, median sizes, property type distributions), trend analysis, and pattern insights including outliers and potential investment signals.
The investor can also provide their own datasets, an existing portfolio spreadsheet, a data export from another tool, and the workflow incorporates it alongside scraped sources.
The final output can be easily adjusted by rewriting the prompt and tweaking component settings. Hundreds of integrations are available to help you get automatic reports where you already work, for example Google docs.
Join our newsletter
Get latest tips, trends, and deals for free.
What the Investor Now Does in 2 Hours That Used to Take 15
The 2-hour weekly routine replaces the 15-hour one by separating what requires human judgment from what doesn’t.
Automated (runs without the investor’s time):
- Data collection across all target markets
- Normalization and deduplication
- Pattern detection and metric calculation
- Report generation for each market
Still requires the investor (the 2 hours):
- Reviewing the reports for each market (~20 minutes per market)
- Spot-checking flagged outliers and undervalued signals against a manual lookup to confirm they’re real
- Making acquisition, monitoring, or exit decisions based on the data
- Updating target market parameters when investment criteria change
The qualitative judgment, for example whether a flagged undervalued area represents an actual opportunity, remains the investor’s job. What’s gone is the mechanical work that preceded that judgment.
How to Set Up Your Own Property Research Automation
The setup requires no technical configuration. The steps are:
Step 1: Define your target markets. Write out each market you want to track as a plain-language description — property type, location, and any price or size parameters. The more specific you are, the more focused the output.
Step 2: Run your first analysis on each market. Open the AI real estate scraper , enter your target market description, and let the workflow run. Review the output to confirm the scope is right and the data reflects the market you care about.
Step 3: Incorporate any existing data. If you have spreadsheets, portfolio data, or exports from other tools, these can be provided alongside the scraped sources for a more complete analysis.
Step 4: Establish a monitoring cadence. Weekly for active acquisition searches, monthly for market tracking and portfolio monitoring. Run the same analysis on the same markets on a defined schedule. Comparing reports over time reveals trend direction that a single snapshot can’t show.
Step 5: Adjust the output as needed. The underlying flow can be modified to focus on specific property types, adjust which metrics are surfaced, or change the output structure to match your reporting format. This is useful if the reports feed into a portfolio dashboard or investor brief.
FlowHunt’s Starter plan at €50/month provides 50 credits per month. A real estate analysis report consumes a small fraction of those credits, meaning the Starter plan comfortably covers multiple market analyses per month alongside any other workflows you need.
Limitations: What AI Can’t Replace in Property Investing
Accurate investment property research automation tools should be clear about what they do and don’t do.
Physical condition: No data tool can assess structural defects, maintenance state, or renovation requirements. A property flagged as undervalued by the data may be priced low for legitimate physical reasons visible only in person.
Seller motivation and off-market dynamics: Motivated sellers, probate situations, distressed sales, or relationship-sourced deals don’t appear in listing data. The scraper works with publicly listed inventory.
Hyperlocal nuance: Which specific building in a neighborhood has a noise problem, which street has a planning restriction, which block is about to change. This kind of ground-level knowledge comes from local agents and direct experience, not aggregated listing data.
Future appreciation: The tool surfaces current pricing patterns and trend signals. It does not predict future price movements. Any tool that claims otherwise should be treated with skepticism.
Legal and title issues: Ownership history, encumbrances, easements, and planning permissions require dedicated legal and title research that falls outside the scope of listing data analysis.
AI handles the information layer, i.e. what the market looks like right now, where the statistical signals are, which areas and properties warrant closer attention. The investment judgment, the due diligence, and the final decision remain human work.
To see how other real estate professionals (agents, developers, analysts) use the same tool in different contexts, see 5 ways real estate professionals use AI data scraping .