This FlowHunt AI real estate scraper tutorial will walk you through every step from entering your target market to working with the structured output. For context on when and why to use the tool, use cases, comparisons, and workflow ideas, see how to scrape real estate listings with AI .
What You Need Before Starting
Before your first run, you need to have two things ready:
- A FlowHunt account. You can try the base tool for free before commiting here: AI real estate scraper . For extensive use or adjustments to the flow, you will need an account. A 7-day free trial lets you run several analyses, as well as other workflows, before full commitment.
- A clear target market in mind. Know the area you want to analyze and what type of property you care about. The input is a plain language description with no technical configuration required. The more specific you are, the more focused the output.
Optionally, if you want to analyze your own dataset (a spreadsheet of listings, a data export from another tool), have that ready to provide alongside your market description.
No API keys, no data connectors, no developer setup, unless you want to set up custom integrations. The tool handles the full pipeline automatically once you submit your input.
Step 1: Define Your Property Search Parameters
Open the Flow library and search for the AI real estate scraper. Add it to your agents. Think through what you want the analysis to cover before typing anything. A clear scope description produces a more useful report than a vague one.
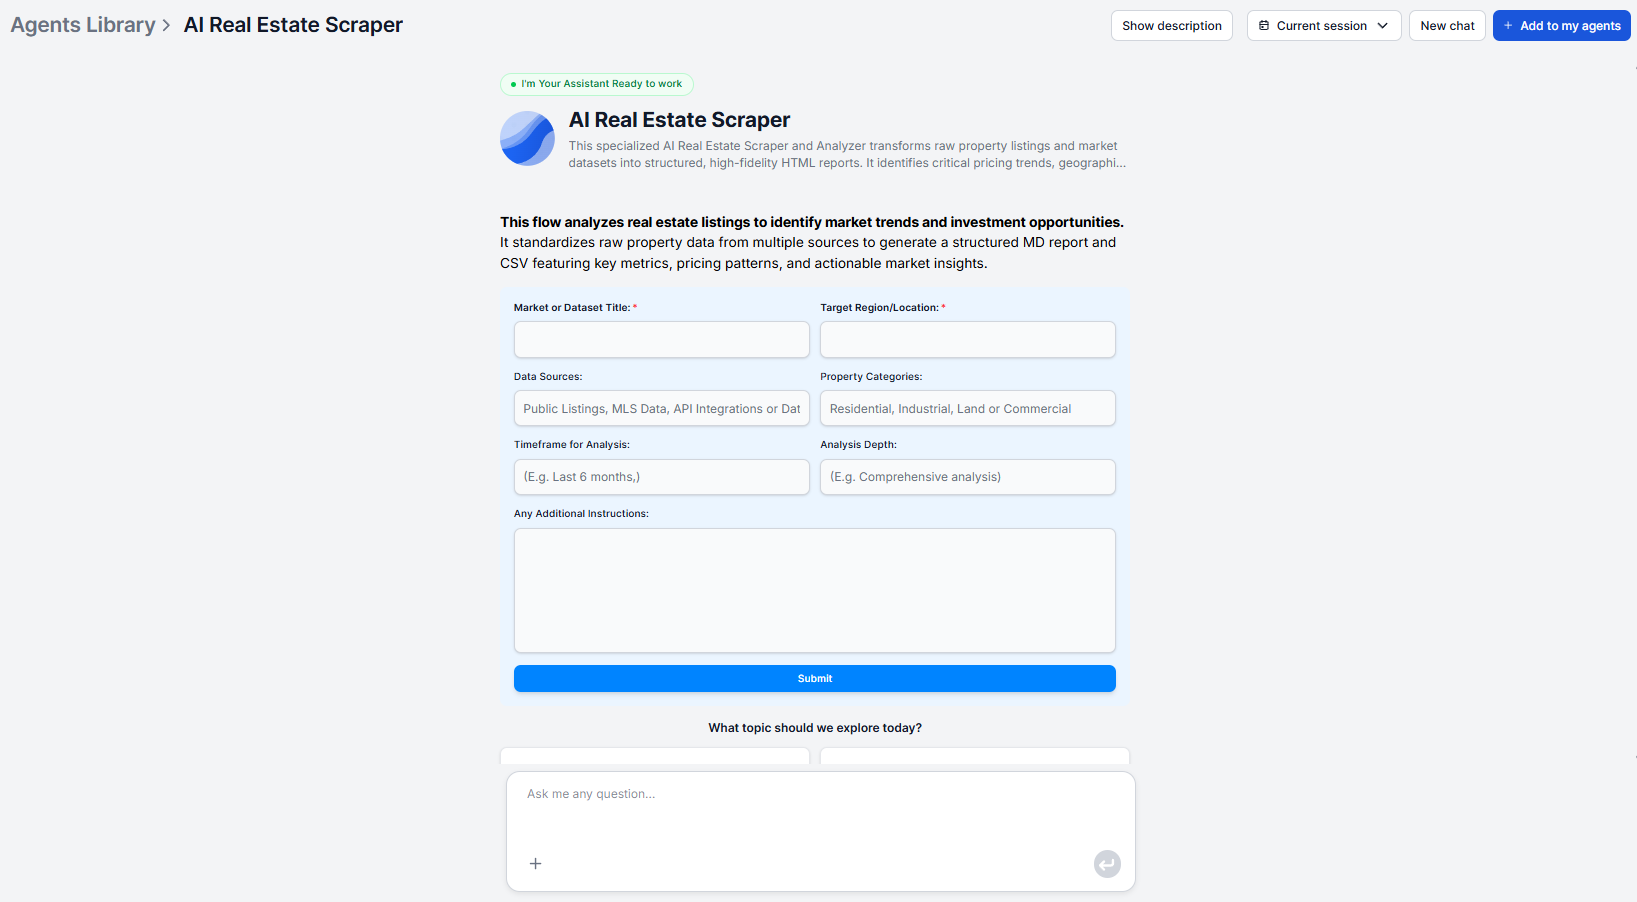
What to include in your target market description:
- Geographic area — city, neighborhood, district, or region. The tighter the area, the more precise the pricing comparisons. In other words, “Central Lisbon” produces a more focused analysis than “Portugal.”
- Property type — residential apartments, single-family homes, commercial units, or a mix. If property type matters to your analysis, name it explicitly.
- Price range — if you’re analyzing a specific investment tier, state the range. “Under €300,000” or “between $500,000 and $1 million” focuses the dataset on the segment you’re evaluating.
- Any other relevant criteria — number of bedrooms, new vs. existing construction, urban vs. suburban. Include whatever is relevant to your research goal.
Example inputs:
- “Residential apartments in Austin, TX”
- “3-bedroom single-family homes under €400,000 in Munich suburbs”
- “Commercial units in central Manchester between £200,000 and £500,000”
A simple city and property type is always enough to get started. Refinements come after your first run once you see what the output covers.
Ready to grow your business?
Start your free trial today and see results within days.
Step 2: Configure the Scraper for Your Target Area
The tool runs with just the target market description you defined in Step 1. There is no separate configuration panel. The natural language input is the configuration.
If you want to adjust what the analysis focuses on or how the output is structured, you have two options:
Include specifics in your description. If your analysis needs to focus on a particular price band, property type, or neighborhood subset, make that explicit in the input rather than relying on the tool to infer it.
Provide your own dataset. If you have an existing data file, such as a spreadsheet of listings you’ve collected, an export from another tool, or a proprietary dataset, you can provide it alongside your market description. The tool incorporates it alongside data collected from online sources and applies the same process.
Adjust the underlying flow. For recurring use cases where you always want the same scope and output structure, or for custom output integrations, the underlying flow in FlowHunt can be modified to target specific property types, adjust which metrics are surfaced, or change the output format. This is useful if the reports feed into a fixed reporting template or dashboard.
Step 3: Run Your First Extraction
Submit your target market description. The tool immediately begins the four-stage pipeline:
Stage 1 — Data collection: The scraper aggregates real estate listings from credible online platforms and APIs within the scope you defined.
Stage 2 — Data cleaning and structuring: All collected listings are standardized before any analysis runs. Price formats are normalized, property types are mapped to consistent categories, square footage and amenity data are aligned, and incomplete, duplicate, or unreliable entries are filtered out.
Stage 3 — Evaluation and pattern detection: The cleaned dataset is analyzed for pricing patterns, availability trends, and correlations between property attributes and price.
Stage 4 — Insight generation: Findings are synthesized into actionable insights, including price distribution, emerging market trends, outliers, undervalued areas, and potential investment opportunities.
The pipeline runs without any input needed on your end after the initial submission. When it completes, the structured report is ready to review.
Join our newsletter
Get latest tips, trends, and deals for free.
Step 4: Review the Report Output
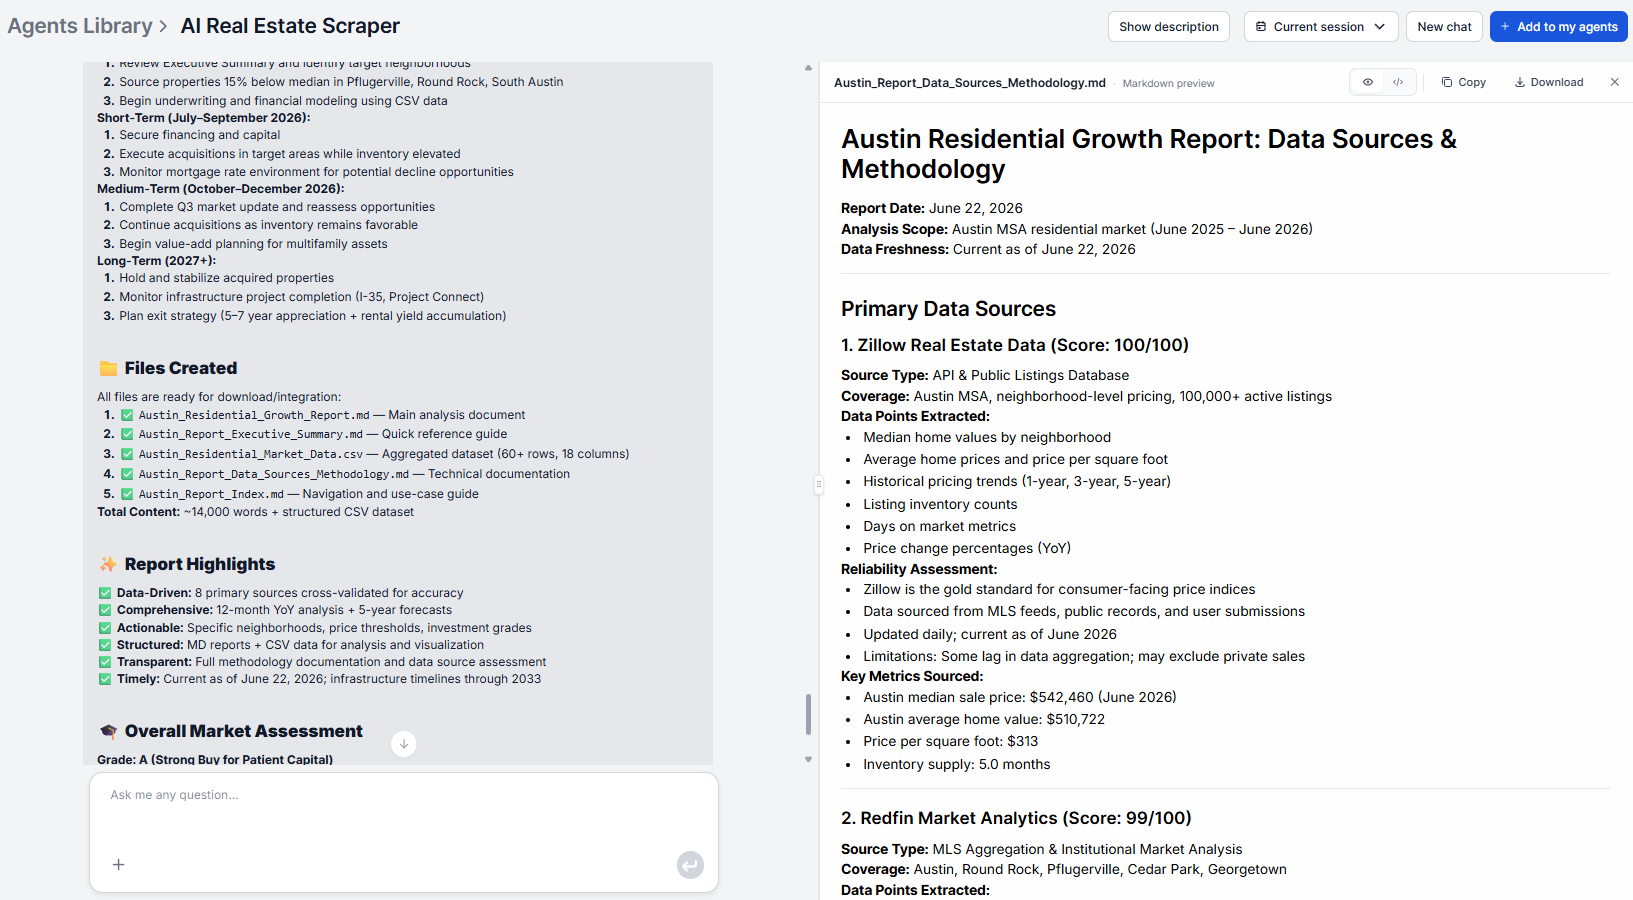
The output is a structured report. Here is what each section contains:
Dataset overview — a summary of the scope covered and the sources accessed, giving you a baseline for how comprehensive the dataset is.
Key metrics and statistics — average prices, median property sizes, and property type distributions across the dataset. These are the headline numbers for understanding the market at a glance.
Trend analysis — significant pricing and availability patterns identified in the data. Urban vs. suburban price differences, seasonal market shifts, emerging neighborhoods, and correlations between property attributes and price.
Pattern insights — Undervalued areas where pricing is lower than the attribute profile would predict, outliers at both ends of the price distribution, and correlations between specific features (size, location, amenity set) and price within the target market.
Read the full output on your first run before drawing conclusions. The pattern insights section in particular surfaces signals that are not obvious from headline metrics alone.
If something in the output looks unexpected, spot-check it against a manual review of a handful of listings in the flagged area. Sometimes an outlier reflects a genuine market signal, sometimes it reflects a data artifact from a single unusual listing.
Step 5: Export and Analyze
The output is structured HTML, which means it moves cleanly into any system that accepts HTML or rich text without reformatting.
Common destinations for the report:
- Investor portals and CMS systems — paste the HTML directly; the structure renders correctly without additional formatting work
- Notion or Confluence — paste as a reference document linked from the relevant deal or market research folder, with the date in the document title so reports from different runs are easy to sequence
- Google Docs — paste the output, add a brief interpretation layer at the top (the two or three findings most relevant to the decision at hand), and share with stakeholders who need context alongside data
- Dashboards or analytical systems — the HTML structure is consistent across every run, which makes it straightforward to parse or integrate into a monitoring pipeline
Pro Tips: Getting More Accurate and Complete Data
Be specific rather than broad. A tight geographic scope with a defined property type produces more actionable analysis than a wide region with no type filter. You can always run multiple focused analyses and compare them rather than running one broad analysis that averages across segments you care about differently.
Provide your own data when you have it. If you have existing research, a portfolio dataset, or a curated list of listings, adding it alongside the scraped sources makes the analysis more relevant to your actual investment parameters. The tool normalizes both sources together.
Run on a consistent cadence to see trends. A single report tells you what the market looks like now. Comparing reports from the same target market run monthly reveals the actual insights. The consistent output format across every run makes comparison straightforward, making it easy to spot changes in median price, emerging neighborhoods, or shifting outliers.
Adjust the flow for recurring use cases. If you run the same analysis regularly, modifying the underlying flow to lock in your standard scope and output structure saves time and ensures consistency across every run.
For a concrete example of what a recurring property research workflow looks like in practice, including the before-and-after time breakdown, see how real estate investors find deals faster with AI .