Manual property research, checking multiple listing sites, copying data into spreadsheets, and comparing prices takes hours. An AI real estate data scraper does the manual and repetitive automatically, leaving only the evaluation and judgment to you. Here’s how to extract structured property data at scale and what you can do with it.
Why Manual Property Research Is a Time Trap
Real estate research is fundamentally a data problem. A single listing tells you the price, the size, and a few features. To understand whether that listing is actually good value, you need context. You need to kow what does the median price look like across similar properties in the same area? Are prices trending up or down? Which neighborhoods are emerging?
Answering those questions manually means opening multiple listing platforms, filtering by the criteria you care about, recording each result, normalizing the data so prices are comparable across sources, filtering out duplicates and outdated listings, and then doing the comparison work.
For a single market, that process easily consumes a full working day, and the moment you need to compare two areas, or track the same market across different time periods, the effort multiplies. What’s more, manual research doesn’t scale, and it doesn’t stay current.
An AI real estate scraping tool automates the entire pipeline. It collects, cleans, and analyzes in one pass. The result is a structured report with insights instead of a messy spreadsheet full of raw data.
How AI Real Estate Scraping Works
The term “scraping” in the context of AI real estate tools covers more than just fetching data from listing pages. A property data collector AI runs a full data pipeline:
Data collection — the tool queries credible online platforms and APIs, aggregating listings across the target market or region you specify. It handles coverage across multiple sources simultaneously.
Data cleaning and normalization — raw listing data is inconsistent across platforms. Prices come in different formats, property types are labeled differently, and some fields are missing or duplicated. The AI standardizes these before analysis, so every property in the dataset is comparable on the same terms.
Pattern detection and analysis — the cleaned dataset is analyzed for pricing distributions, availability trends, and correlations between property attributes (size, location, amenity set) and price.
Report generation — findings are synthesized into a structured report with a dataset overview, key metrics, trend analysis, and pattern insights.
Unlike a raw export from a basic real estate scraping tool, a property data extraction AI produces analysis alongside the data. Pricing trends, outliers, undervalued areas, and market patterns are surfaced automatically rather than left for you to calculate from raw exports.
Ready to grow your business?
Start your free trial today and see results within days.
What Data Can Be Extracted from Listings
A real estate data automation workflow extracts and structures several types of data from property listings:
Pricing data: average and median prices across the dataset, price distribution by property type, price-per-square-metre ratios, and outlier detection.
Property attributes: property type (residential, apartment, detached, commercial), size, number of bedrooms and bathrooms, key amenities.
Location patterns: urban vs. suburban price differences, pricing variation by neighborhood or area, emerging neighborhoods where prices are rising faster than the surrounding market, and areas that appear undervalued relative to comparable locations.
Market dynamics: listing volume, time-on-market patterns, seasonal market shifts that affect both availability and pricing.
Correlations: which property attributes have the strongest relationship with price within a given market. This is useful for evaluating whether a specific listing is priced correctly relative to its actual features.
The depth of what gets extracted depends on what’s available in the source data. Markets with dense listing activity and detailed property descriptions produce richer analysis than sparse markets.
Step-by-Step: Your First Property Data Extraction
The AI real estate scraper is designed to be straightforward. You don’t need to configure data sources, write scraping rules, or set up a cleaning pipeline, as the workflow handles all of that. If you need to, you can specify the sources you prefer or add your own dataset.
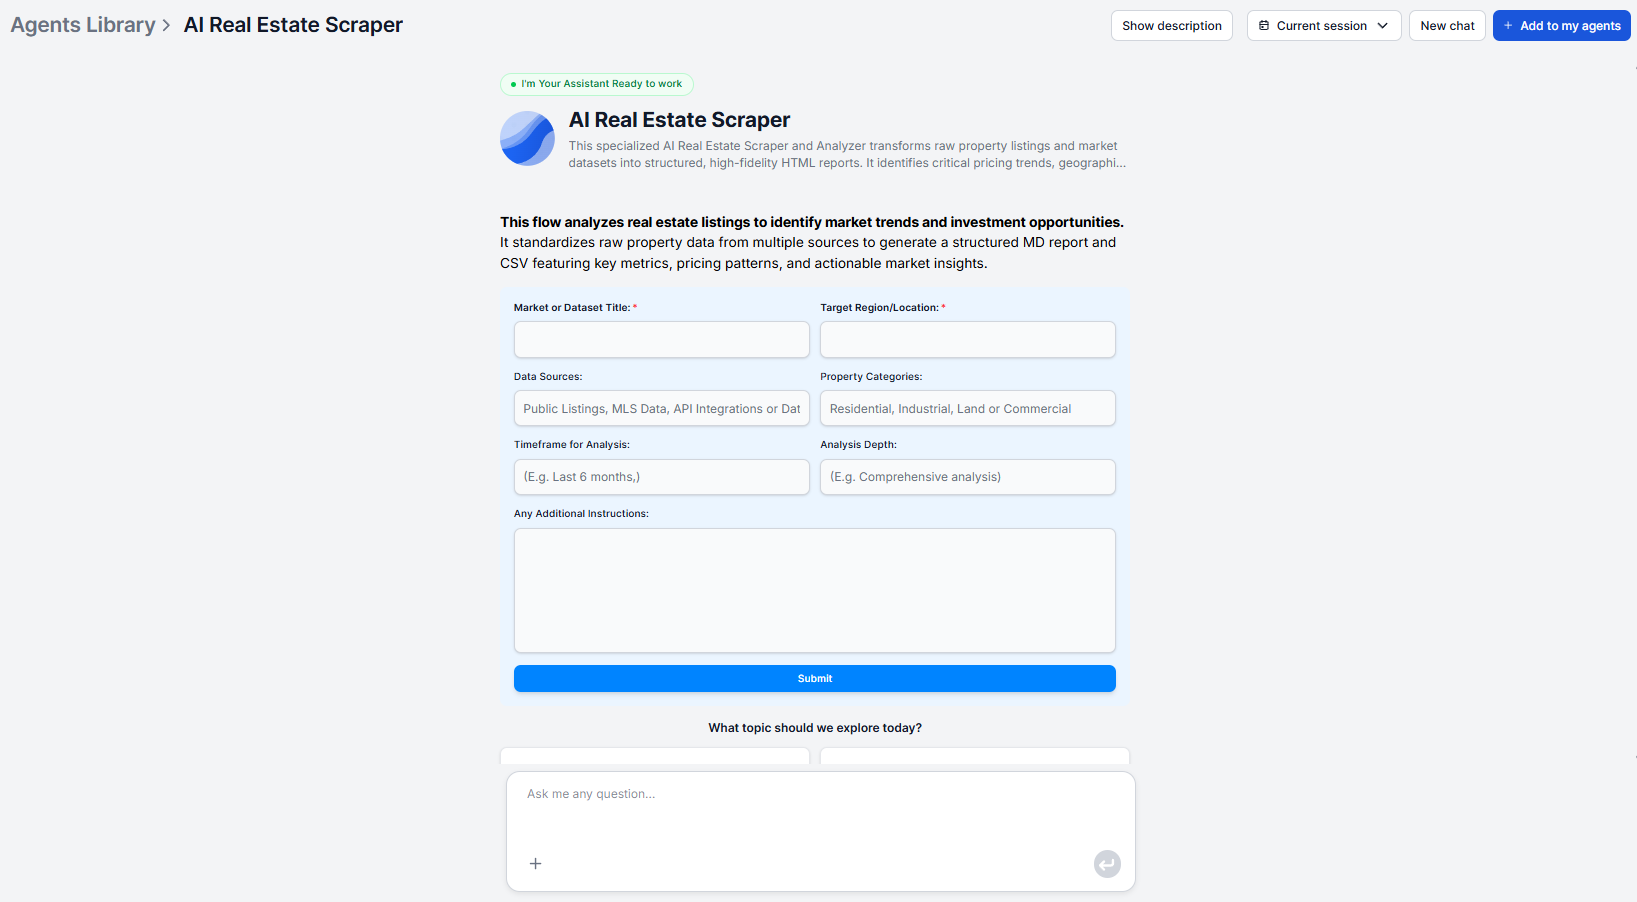
Step 1: Specify your target market
Enter a target market or region description. “Residential properties in Austin, TX” or “apartments in central Berlin” is enough as a starting point. If you want focused results, you can be more specific, asking for a particular neighborhood, price range, or property type. You can also provide your own datasets or structured files to be incorporated alongside data collected from online sources.
Step 2: Data collection runs automatically
The tool queries credible online platforms and APIs, aggregating listings that match your specified scope across multiple sources simultaneously. You don’t need to run separate searches on different listing sites and reconcile the results manually.
Step 3: Data is cleaned and normalized
Before any analysis happens, collected listings are standardized. Price formats are normalized, property types are mapped to consistent categories, square footage and amenity data are aligned. Any incomplete, duplicate, or unreliable entries are filtered out.
Step 4: Pattern detection and insight generation
The structured dataset is analyzed for pricing patterns, availability trends, and correlations between property attributes and price. The tool identifies both macro patterns (overall market pricing, distribution by property type) and micro-level signals ( neighborhoods with emerging price momentum, undervalued properties, outliers).
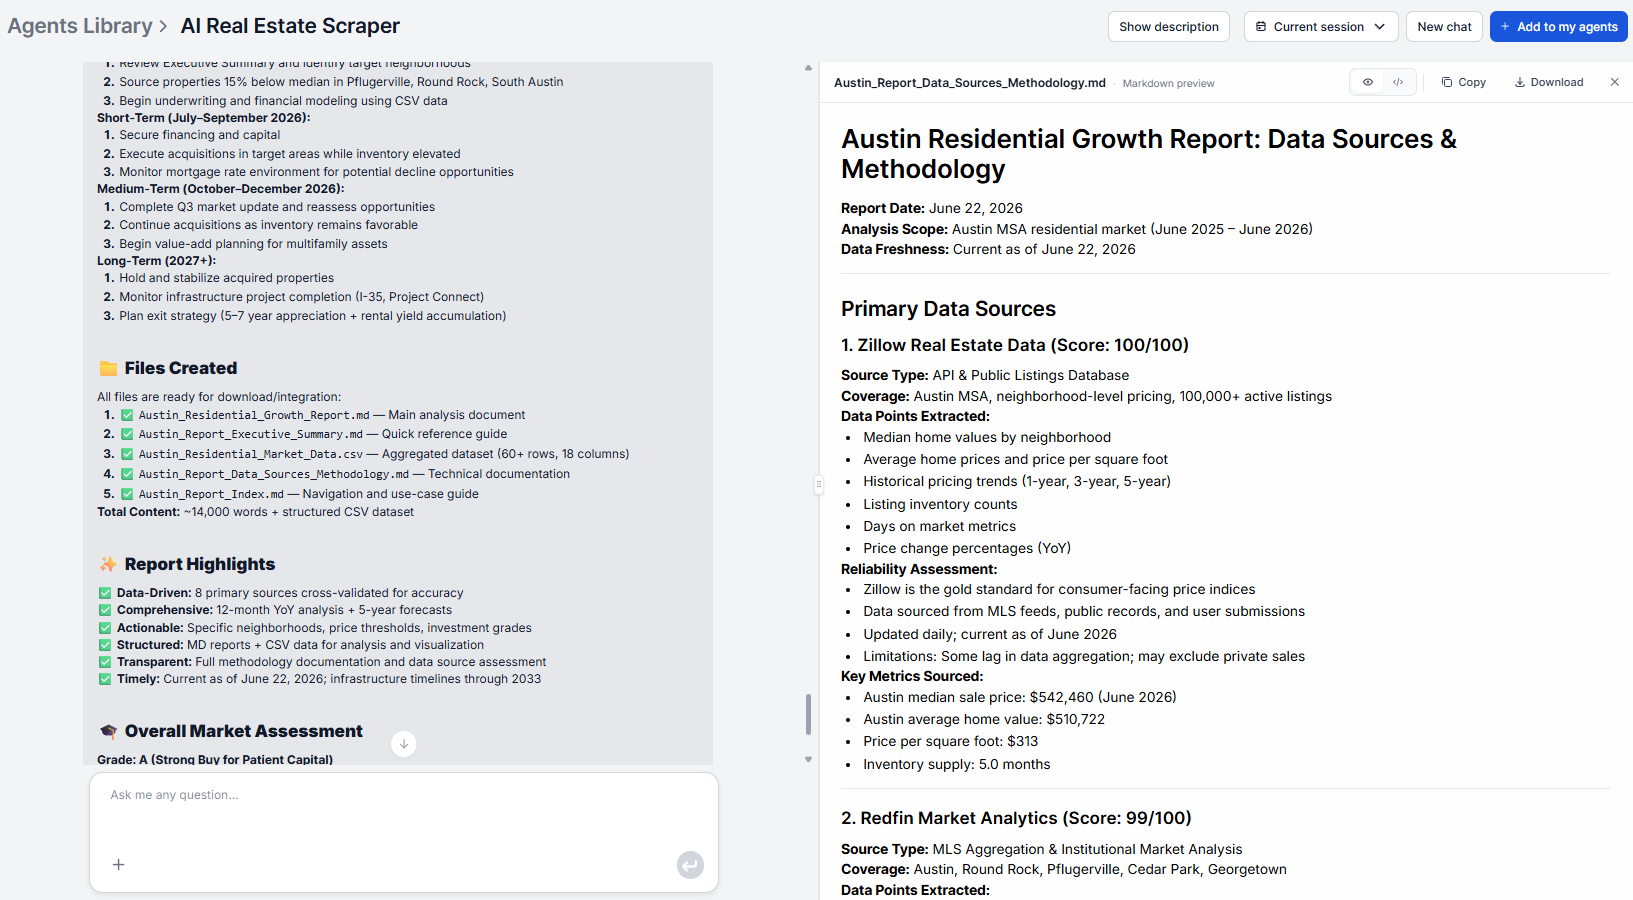
Step 5: Review the structured report
The output is a structured report covering:
- A dataset overview with scope and source summary
- Key metrics, such as average prices, median sizes, property type distributions
- Trend analysis of pricing patterns, seasonal shifts, urban vs. suburban dynamics
- Pattern insights about outliers, undervalued areas, correlations, and potential investment signals
The tool can be setup to output directly into a CMS, investor portal, dashboard, or analytical system. All you need to do is connect your tool and make sure the output format is supported.
For a full interface walkthrough and pro tips on getting the most accurate output, see the AI real estate scraper tutorial .
Join our newsletter
Get latest tips, trends, and deals for free.
Use Case: Market Price Analysis by Area
One of the most immediate applications of a property data extraction AI is price analysis across a defined geography. Instead of sampling a handful of listings to estimate where prices sit, you get a statistically grounded picture of the full market.
An investor evaluating two neighborhoods in the same city wants to understand whether the price premium in one area is justified, or whether it’s possible to get comparable value at a lower cost. Running the scraper across both areas produces a side-by-side comparison of these attributes.
The trend analysis component adds time context. A neighborhood with a lower median price but a strong upward trend may represent a more valuable opportunity than one with a high current median but flat trajectory. These are the patterns that manual researchers tends to miss because they require analyzing a large enough sample.
Use Case: Finding Off-Market Opportunities
Not every opportunity comes from a listing that’s already priced correctly. The outlier and undervalued-area detection built into an AI property listing scraper surfaces properties and neighborhoods where the data suggests a pricing gap relative to comparable areas.
Undervalued area detection works by comparing a neighborhood’s attribute profile against its actual pricing relative to comparable areas. When the pricing is lower than the attribute profile would predict, it registers as a potential opportunity.
This is real estate data automation applied at a level of analysis that’s impractical to do manually. Identifying these signals requires comparing patterns across large sets of listings simultaneously, not just reviewing a few pages of results.
For teams working at the organizational level, evaluating real estate companies, developers, or PropTech platforms in a target market, combining this property-level intelligence with the company analysis tool gives a fuller picture of both the market and the key players operating in it.
How to Structure and Analyse the Extracted Data
The report is structured for immediate use, but how you deploy it depends on your workflow.
For investment decisions: the key metrics section, i.e. price distributions, median sizes, property type breakdowns, provides the statistical foundation. Pattern insights add the qualitative layer, such as which areas are flagged as undervalued, which correlations are strong enough to affect acquisition criteria, and more.
For client-facing market reports: the output can be set up to go directly into a CMS or investor portal.
For ongoing market monitoring: running the tool on a defined cadence and comparing outputs over time builds a longitudinal view of market dynamics. Price trends become visible at longer time horizons, and emerging neighborhoods can be tracked from early signals.
For integration into broader research: the property-level analysis is one layer in a full due diligence or investment research process. Pairing it with competitor analysis in real estate , and market-level intelligence covers the full picture from individual listings to competitive landscape.
The underlying flow can also be modified. If you need to focus on specific property types, adjust which metrics are surfaced, connect your tools or change the output structure to fit your reporting format, the workflow is adjustable without rebuilding it from scratch.
To see how different professionals (agents, investors, developers) apply these outputs day to day, see 5 ways real estate professionals use AI data scraping .