



How to Do Market Analysis with AI in Under 30 Minutes
TAM/SAM/SOM calculations, competitor landscapes, market trends, and growth forecasts — AI market analysis tools can cover all of those automatically. Here's how...
8 min read
AI
Research
+3

SWOT, PESTLE, Porter’s Five Forces, and TAM/SAM/SOM all take days to complete manually. Here’s how AI applies each one automatically and what output quality to expect.
SWOT, PESTLE, Porter’s Five Forces, Blue Ocean, TAM/SAM/SOM take days to complete manually. Each requires pulling data from multiple sources, mapping it to the framework’s structure, and synthesizing findings into something a stakeholder can actually use. An AI market analysis Agent compresses the process from days to minutes. Here’s how AI applies each one automatically and what output quality to expect. Not sure how to run a report yet? Start with how to do market analysis with AI in under 30 minutes .
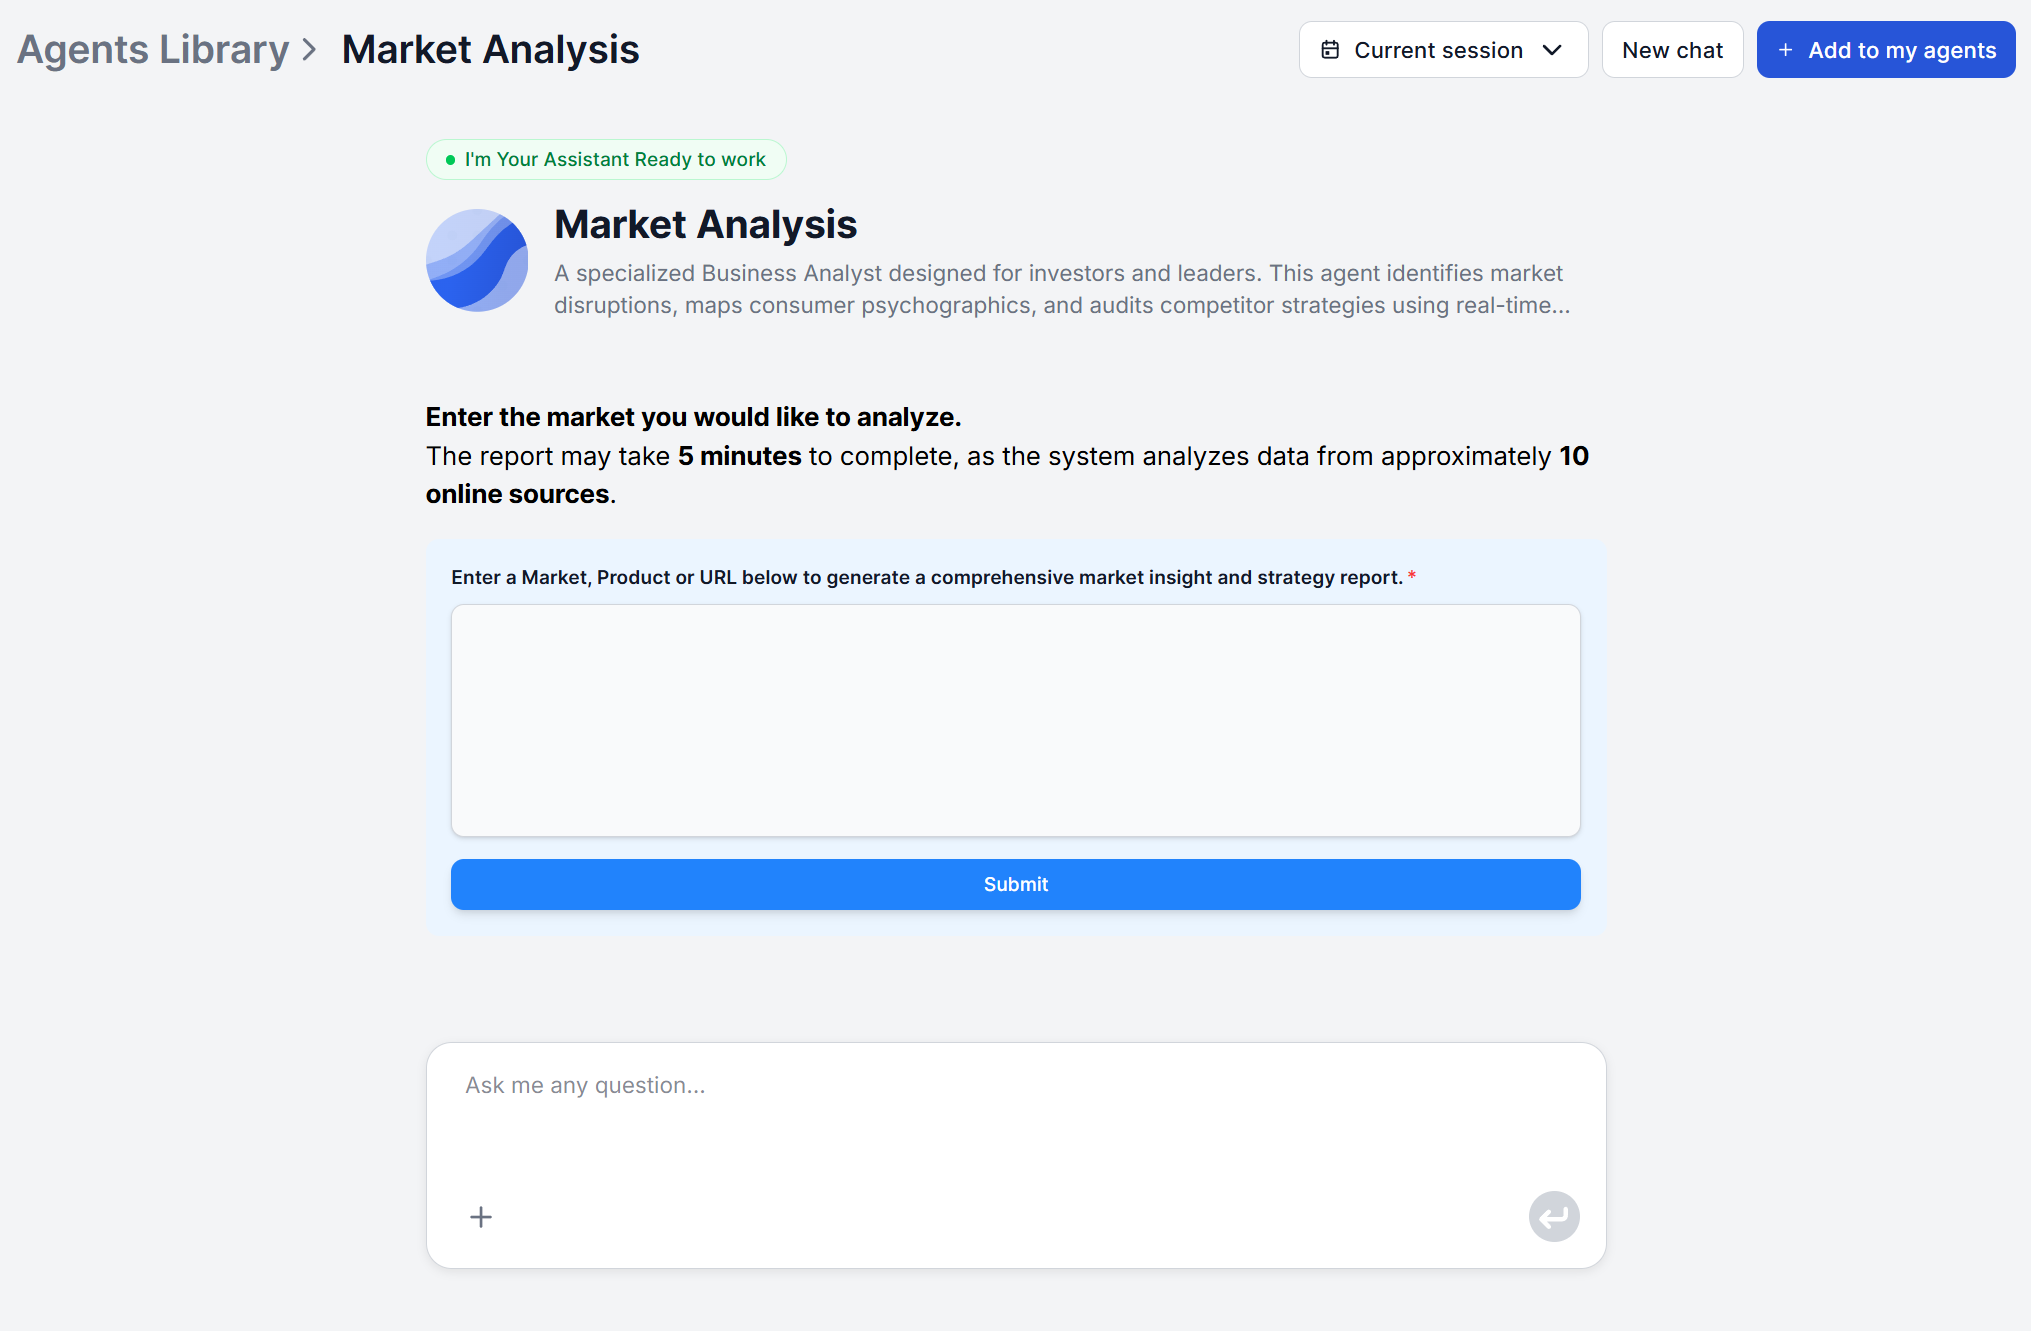
SWOT (Strengths, Weaknesses, Opportunities, Threats) is the most widely used strategic framework, and also the one most often done poorly. Manual SWOT analysis suffers from recency bias, researcher blind spots, and a tendency to over-index internal factors while underweighting external ones. SWOT analysis AI tools address these gaps by drawing from multi-source market intelligence rather than a single researcher’s working knowledge.
The Market Analysis Agent explicitly produces a SWOT synthesis as part of its strategic recommendations section, built from the competitive dynamics, market trends, and customer segment data it surfaces across the report.
Here’s an example of what an typical AI-generated SWOT analysis for a SaaS project management might surface:
Strengths: Deep product integrations with enterprise toolchains, high switching costs due to data and workflow lock-in, strong brand recognition in the mid-market segment.
Weaknesses: Premium pricing limits penetration in the SMB segment, limited mobile experience relative to emerging competitors, geographic concentration in North American customer base.
Opportunities: Expanding compliance requirements driving process documentation demand, underserved operations teams in manufacturing and logistics, AI-native workflow features lagging in incumbent products.
Threats: AI-native entrants offering comparable functionality at lower price points, consolidation risk as larger platforms add project management natively, economic pressure driving multi-tool rationalization.
PESTLE maps the macro-environment across the political, economic, social, technological, legal, and environmental dimensions. It’s the foundational tool for market entry decisions and long-range planning, as well as the framework most likely to have blind spots when done by a team too close to their own industry.
AI PESTLE analysis works by mapping market trend and regulatory intelligence to each dimension, producing a structured scan of the external environment a market is operating in.
PESTLE is most useful at the market entry stage or when major macro shifts are underway. AI removes the tedious source-synthesis step, so the analyst focuses on weighting the dimensions that matter most for their specific strategic question.
A representative AI-generated PESTLE output for an e-commerce logistics market might look a little something like this:
Political: Trade policy volatility affecting cross-border shipping costs, government investment programs in domestic logistics infrastructure.
Economic: Rising fuel costs compressing last-mile margins, consumer spending shifts toward value-oriented delivery expectations.
Social: Growing consumer demand for same-day and sustainable delivery options, urban density increasing the viability of micro-fulfillment models.
Technological: Autonomous delivery pilots expanding from proof-of-concept to limited commercial deployment, AI-driven route optimization widening efficiency gaps between operators.
Legal: Data privacy regulations affecting shipment tracking and customer notification systems, gig economy reclassification risk for delivery workforce models.
Environmental: Carbon disclosure requirements tightening across key markets, measurable growth in consumer preference for low-emission last-mile options.

Start your free trial today and see results within days.
Porter’s Five Forces evaluates the structural attractiveness of a market by analyzing competitive intensity across the dimensions of competitive rivalry, supplier power, buyer power, threat of new entrants, and threat of substitutes. This framing helps investors and strategy teams quickly assess whether a market’s structure supports the margins and growth trajectory they need before committing significant resources.
Porter’s Five Forces AI analysis draws from competitor data, market trend information, and supply chain structure to map intensity ratings across each force.
A representative output for a B2B HR software market:
Competitive rivalry — HIGH: Crowded market with multiple funded players competing on overlapping feature sets, differentiation primarily on integration breadth and customer support quality.
Supplier power — LOW: Infrastructure dependency on cloud providers with no meaningful concentration risk, talent supply tight but not competitively distorting at the market level.
Buyer power — MEDIUM-HIGH: Enterprise buyers increasingly sophisticated in multi-vendor evaluations, procurement cycles extending as CFO approval requirements rise across the customer base.
Threat of new entrants — MEDIUM: Low capital requirements for MVP-stage entry, offset by high enterprise trust requirements and compliance certification barriers.
Threat of substitutes — HIGH: Larger HCM platforms bundling standalone HR tools, adjacent workflow tools expanding into HR-adjacent functionality.
TAM (Total Addressable Market), SAM (Serviceable Addressable Market), and SOM (Serviceable Obtainable Market) form the market sizing progression that appears in every investment deck and product strategy document. Manual sizing requires reconciling top-down analyst estimates with bottom-up unit economics, a process that can quickly become a week-long exercise in source triangulation.
AI market sizing works differently. Rather than generating a single authoritative number, a market framework analysis tool synthesizes publicly available market data, growth rate estimates, and segment information into a structured sizing framework that the analyst applies their own assumptions to.
For a market entry decision, an AI-generated TAM/SAM/SOM output provides the total revenue opportunity at full market penetration, the realistically addressable segment, and a realistic capture range based on competitive dynamics.
Get latest tips, trends, and deals for free.
Competitive landscape mapping goes beyond listing competitors. It positions players relative to each other across strategic dimensions, such as pricing, target customer, feature depth, or geographic focus, and identifies opportunities for a new entrant or expansion.
A strategic AI analysis approach draws from the competitor analysis sections of the market report and structures findings around positioning axes.
Pair competitive landscape data from the market analysis tool with product-level intelligence from AI product analysis for a full two-layer view. For the organizational layer, add a company analysis run on any target worth examining closely.
Different questions call for different frameworks. A common failure mode is defaulting to SWOT for every strategic question. It’s the most familiar, but it doesn’t always surface the most decision-relevant information.
| Use case | Best framework |
|---|---|
| Initial market orientation | SWOT — fast, broad, stakeholder-friendly |
| Market entry decision | PESTLE — maps the macro environment and regulatory risk |
| Competitive attractiveness assessment | Porter’s Five Forces — evaluates structural profitability |
| Investment deck or fundraising | TAM/SAM/SOM — standard investor expectation |
| Ongoing competitor monitoring | Competitive landscape mapping — tracks positioning over time |
| Product roadmap planning | Combine competitive landscape + customer segment analysis |
For most strategic projects, the correct answer is running two or three frameworks rather than one. Each is designed to answer a different question, the risk in picking only one is missing the dimension it doesn’t cover.
The most useful strategic analyses layer frameworks rather than treating them as mutually exclusive. SWOT works well as a synthesis layer after PESTLE and Porter’s have mapped the external environment. The macro factors from PESTLE become the Opportunities and Threats in SWOT, while Porter’s forces inform the competitive dimension.
Competitive landscape mapping with TAM/SAM/SOM reveals how much of that scale is realistically capturable given who’s already in the market. Run them together and you have both the size of the prize and a grounded view of the probability of winning it.
AI removes the main barrier to running multiple frameworks, which is the time cost. Each framework used to represent a separate multi-day research effort. With automated market analysis, running three frameworks in sequence is a morning’s work rather than a week-long project, and the findings from each inform how to interpret the others.
Ready to run your first analysis? Follow the Market Analysis Tool tutorial for a step-by-step walkthrough, or see AI market research tools compared if you’re still deciding which platform to use.
Maria is a copywriter at FlowHunt. A language nerd active in literary communities, she's fully aware that AI is transforming the way we write. Rather than resisting, she seeks to help define the perfect balance between AI workflows and the irreplaceable value of human creativity.

FlowHunt's Market Analysis Agent delivers structured strategic reports covering competitive dynamics, market trends, customer segments, and SWOT synthesis — from a single input. No manual research required.
TAM/SAM/SOM calculations, competitor landscapes, market trends, and growth forecasts — AI market analysis tools can cover all of those automatically. Here's how...
FlowHunt's Market Analysis Agent delivers executive-level strategic reports covering market trends, customer segments, competitive landscape, logistics, and pay...
Step-by-step from entering your market or industry to downloading a complete market intelligence report, including how to customise focus areas and interpret ea...
Cookie Consent
We use cookies to enhance your browsing experience and analyze our traffic. See our privacy policy.