Running competitive research manually is slow and inconsistent. This FlowHunt product analysis tutorial walks you through every step, from entering a URL to interpreting your first competitive report and sharing it with the team. For a conceptual overview of what AI product analysis covers and common use cases by team type, see how to do AI product analysis .
What You Need Before Starting
Before your first run, have three things ready:
- A FlowHunt account. You can start a free trial with no credit card required. The AI product analysis tool is available from day one.
- The product URL or name. A URL produces more accurate results. It removes ambiguity when multiple products share similar names and directs the tool to the right source. A product name works too, but be specific.
- A goal for the analysis. What decision does this research feed? Feature gap analysis before roadmap planning, pricing benchmarking, a pre-launch competitor scan? Knowing your goal upfront shapes how you interpret the output and which sections to prioritise.
No API keys, no data connectors, no onboarding call. The tool handles the research layer automatically once you have those three things in place. For examples of what happens when competitive analysis is skipped at launch, see 5 products that failed because they skipped competitive analysis .
Step 1: Enter the Product or Company URL

Open the AI product analysis tool and type the product URL or name into the input field. A URL is preferred — it eliminates ambiguity and anchors the retrieval to the correct target without the tool having to guess between similar-sounding products.
If you only have a product name, be specific. “Salesforce” works. “CRM tool” does not, as it is too broad for a reliable, focused retrieval.
Tips for better input:
- Use the product’s main marketing URL, not a deep internal page or a support article
- For SaaS products, the pricing page URL often produces especially detailed pricing section output
- For a product with no dedicated website, the brand’s main domain, LinkedIn company page, or App Store listing is the best fallback
Once you submit, the tool begins querying live sources: the product’s own website, third-party review platforms such as G2 and Capterra, press coverage, community forums, and any available documentation. This retrieval phase typically takes two to four minutes with no input needed on your end.
Ready to grow your business?
Start your free trial today and see results within days.
Step 2: Select Analysis Depth and Focus Areas
The default configuration runs a full-spectrum analysis covering all standard dimensions. For a first-time run with an unfamiliar product, leave the default in place — the full output often surfaces information you did not know to look for.
If your use case is narrower, direct the tool via the chat interface after submitting the initial URL. For example:
- “Focus only on pricing tiers and free trial terms.”
- “Expand the feature inventory for the reporting and analytics category.”
- “Summarise the user sentiment section by reviewer role where possible.”
This is the how to use AI product analysis approach that saves time once you know which dimensions are relevant for a given decision. For a first run, the full output gives you a baseline before you start narrowing.
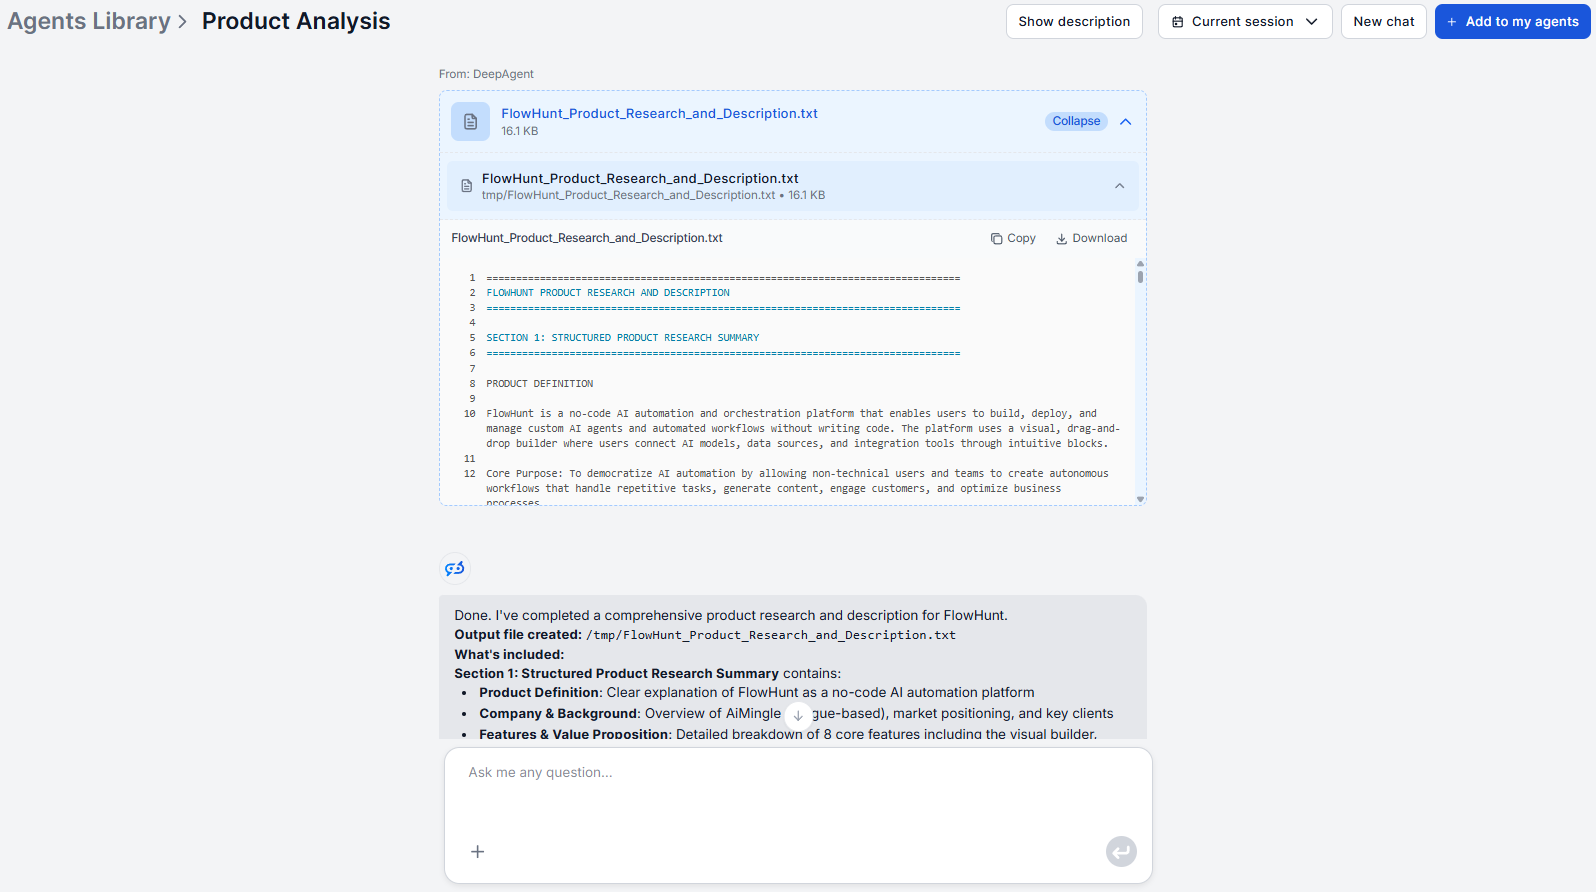
Step 3: Review the Automated Report Sections

The output is a structured HTML report with consistent sections across every run. Here is what each section contains:
Feature inventory — A categorised breakdown of the product’s capabilities, organised by functional area with a brief description for each feature. Not just a list of labels, but a structured breakdown of what each feature actually does.
Pricing model — Tier names, pricing per tier where public, included feature limits at each level, and any enterprise pricing signals. Free trial terms and freemium conditions are called out separately so you can read the access model clearly.
Positioning and target audience — How the vendor describes the product in its own language, which customer segments it explicitly targets, and the core pain points it claims to solve. Useful for understanding how a competitor frames the problem you both address.
User sentiment — Aggregated patterns from public reviews: what users consistently praise, what they consistently complain about, and any recurring themes segmented by user role or company size where review data makes that possible.
Competitive landscape — Products most frequently compared to this one, where it wins or loses those comparisons, and any publicly stated differentiators the vendor uses in its own positioning.
Recent developments — Product launches, funding announcements, leadership changes, or strategic pivots surfaced in recent press coverage and company communications.
On your first run, read the full output before filtering. On subsequent runs, you will know which sections matter most for the decision at hand.
Join our newsletter
Get latest tips, trends, and deals for free.
Step 4: Interpret Features, Pricing, and Positioning Data
The report is raw structured intelligence. Interpretation is the layer you add.
Features: Cross-reference the feature list against the product’s actual pricing page. Features listed in marketing copy sometimes appear only on the highest tier or require a paid add-on. Make note of what is gated and at what level — that tells you where the product’s real commercial pressure points are.
Pricing: Look at the structure, not just the numbers. A per-seat pricing model behaves very differently at scale than a usage-based or flat-rate model. Note where the free tier ends, what the trigger for an upgrade is, and whether enterprise pricing is publicly indicated or requires a sales conversation.
Positioning: Read the positioning section with your own customer in mind. Where the competitor addresses the same pain points your product does, that is your primary competitive overlap. Where they omit your category or frame the problem differently, that may signal a gap or a differentiation angle worth exploring in your own messaging.
Sentiment: Weight recent reviews more than older ones. Where review data includes role or company size context, filter for the segment that matches your target buyer profile. Patterns that recur across multiple reviewer types carry more weight than isolated complaints from a single user segment.
Step 5: Export and Share the Report
The output is portable HTML — structured, clean, and easy to move into your existing workflow. Common sharing patterns from teams using a product research workflow AI:
- Paste into Notion or Confluence as a reference document linked from the relevant roadmap page or competitive intelligence folder, so the team can comment directly on the source data
- Drop into Slack with a two-sentence summary of what decision it informs and which findings are most relevant
- Google Docs for cross-functional review — paste the output, then add a brief interpretation section at the top before sharing with stakeholders who need context, not just data
- Battle card source layer — the feature inventory, pricing model, and positioning sections map directly onto standard battle card formats; paste the structured output and fill the template from it rather than researching from scratch
For a first-time run, share both the full output and a short interpretation layer. Teams that receive raw data without framing rarely act on it; those that receive data plus a clear “so what” are much more likely to use it in a decision.
How to Set Up Recurring Analyses
Point-in-time analysis is useful. Recurring analysis is where competitive intelligence compounds.
A practical cadence for most teams:
- Monthly for tier-one competitors — the ones you lose deals to most often or are most frequently compared against in sales conversations
- Quarterly for tier-two competitors — products that overlap partially with your market but are not primary rivals
- On-demand before pricing decisions, product launches, roadmap reviews, or any high-stakes sales or partnership conversation
FlowHunt supports scheduled workflow runs, which means you can automate the cadence rather than relying on calendar reminders that get skipped under deadline pressure. For product manager-specific workflows that put this cadence into practice, see 5 ways product managers use AI product analysis . Browse the AI flow templates for a scheduled competitive research setup, or build a custom one directly in FlowHunt’s workflow editor.
The consistent output format across every run is what makes this competitive analysis step by step tutorial approach work at scale: when a competitor updates their pricing structure or ships a significant feature, it shows up clearly in the next scheduled report without any manual effort to detect the change.
The right starting point is a single run. Open the AI product analysis tool, enter the URL of the competitor most relevant to your next decision, and run your first report. The rest of the workflow follows naturally once you have seen what the output contains. Comparing AI competitive intelligence tools to choose the right platform? See our comparison of FlowHunt vs Crayon vs Klue vs Kompyte vs Battlecard .