
Prometheus MCP Integration
Integrate FlowHunt with Prometheus via the Model Context Protocol (MCP) for secure AI-driven monitoring, automated PromQL querying, and seamless metric analytic...
4 min read
AI
Prometheus
+4

Seamlessly connect AI assistants to Prometheus for real-time monitoring, automated analytics, and DevOps insights with the Prometheus MCP Server.
The Prometheus MCP Server is a Model Context Protocol (MCP) implementation that enables AI assistants to interact with Prometheus metrics using standardized interfaces. By acting as a bridge between AI agents and Prometheus, it allows for seamless execution of PromQL queries, discovery and exploration of metric data, and provides direct access to time-series analytics. This empowers developers and AI tools to automate monitoring, analyze infrastructure health, and gain operational insights without manual data retrieval. Key features include metric listing, metadata access, support for both instant and range queries, and configurable authentication (basic auth or bearer token). The server is also containerized for easy deployment and can be flexibly integrated with various AI development workflows.
No information about prompt templates is provided in the repository.
Start your free trial today and see results within days.
No explicit resources (as defined by MCP) are listed in the repository.
Get latest tips, trends, and deals for free.
No specific instructions are provided for Windsurf in the repository.
PROMETHEUS_URL, credentials).mcpServers object:{
"mcpServers": {
"prometheus": {
"command": "uv",
"args": [
"--directory",
"<full path to prometheus-mcp-server directory>",
"run",
"src/prometheus_mcp_server/main.py"
],
"env": {
  "PROMETHEUS_URL": "http://your-prometheus-server:9090",
  "PROMETHEUS_USERNAME": "your_username",
  "PROMETHEUS_PASSWORD": "your_password"
}
}
}
}
Note: If you see Error: spawn uv ENOENT, specify the full path to uv or set the environment variable NO_UV=1 in the configuration.
No specific instructions are provided for Cursor in the repository.
No specific instructions are provided for Cline in the repository.
Securing API Keys
Sensitive values such as API keys, usernames, and passwords should be set via environment variables.
Example (in JSON configuration):
"env": {
"PROMETHEUS_URL": "http://your-prometheus-server:9090",
"PROMETHEUS_USERNAME": "your_username",
"PROMETHEUS_PASSWORD": "your_password"
}
Using MCP in FlowHunt
To integrate MCP servers into your FlowHunt workflow, start by adding the MCP component to your flow and connecting it to your AI agent:
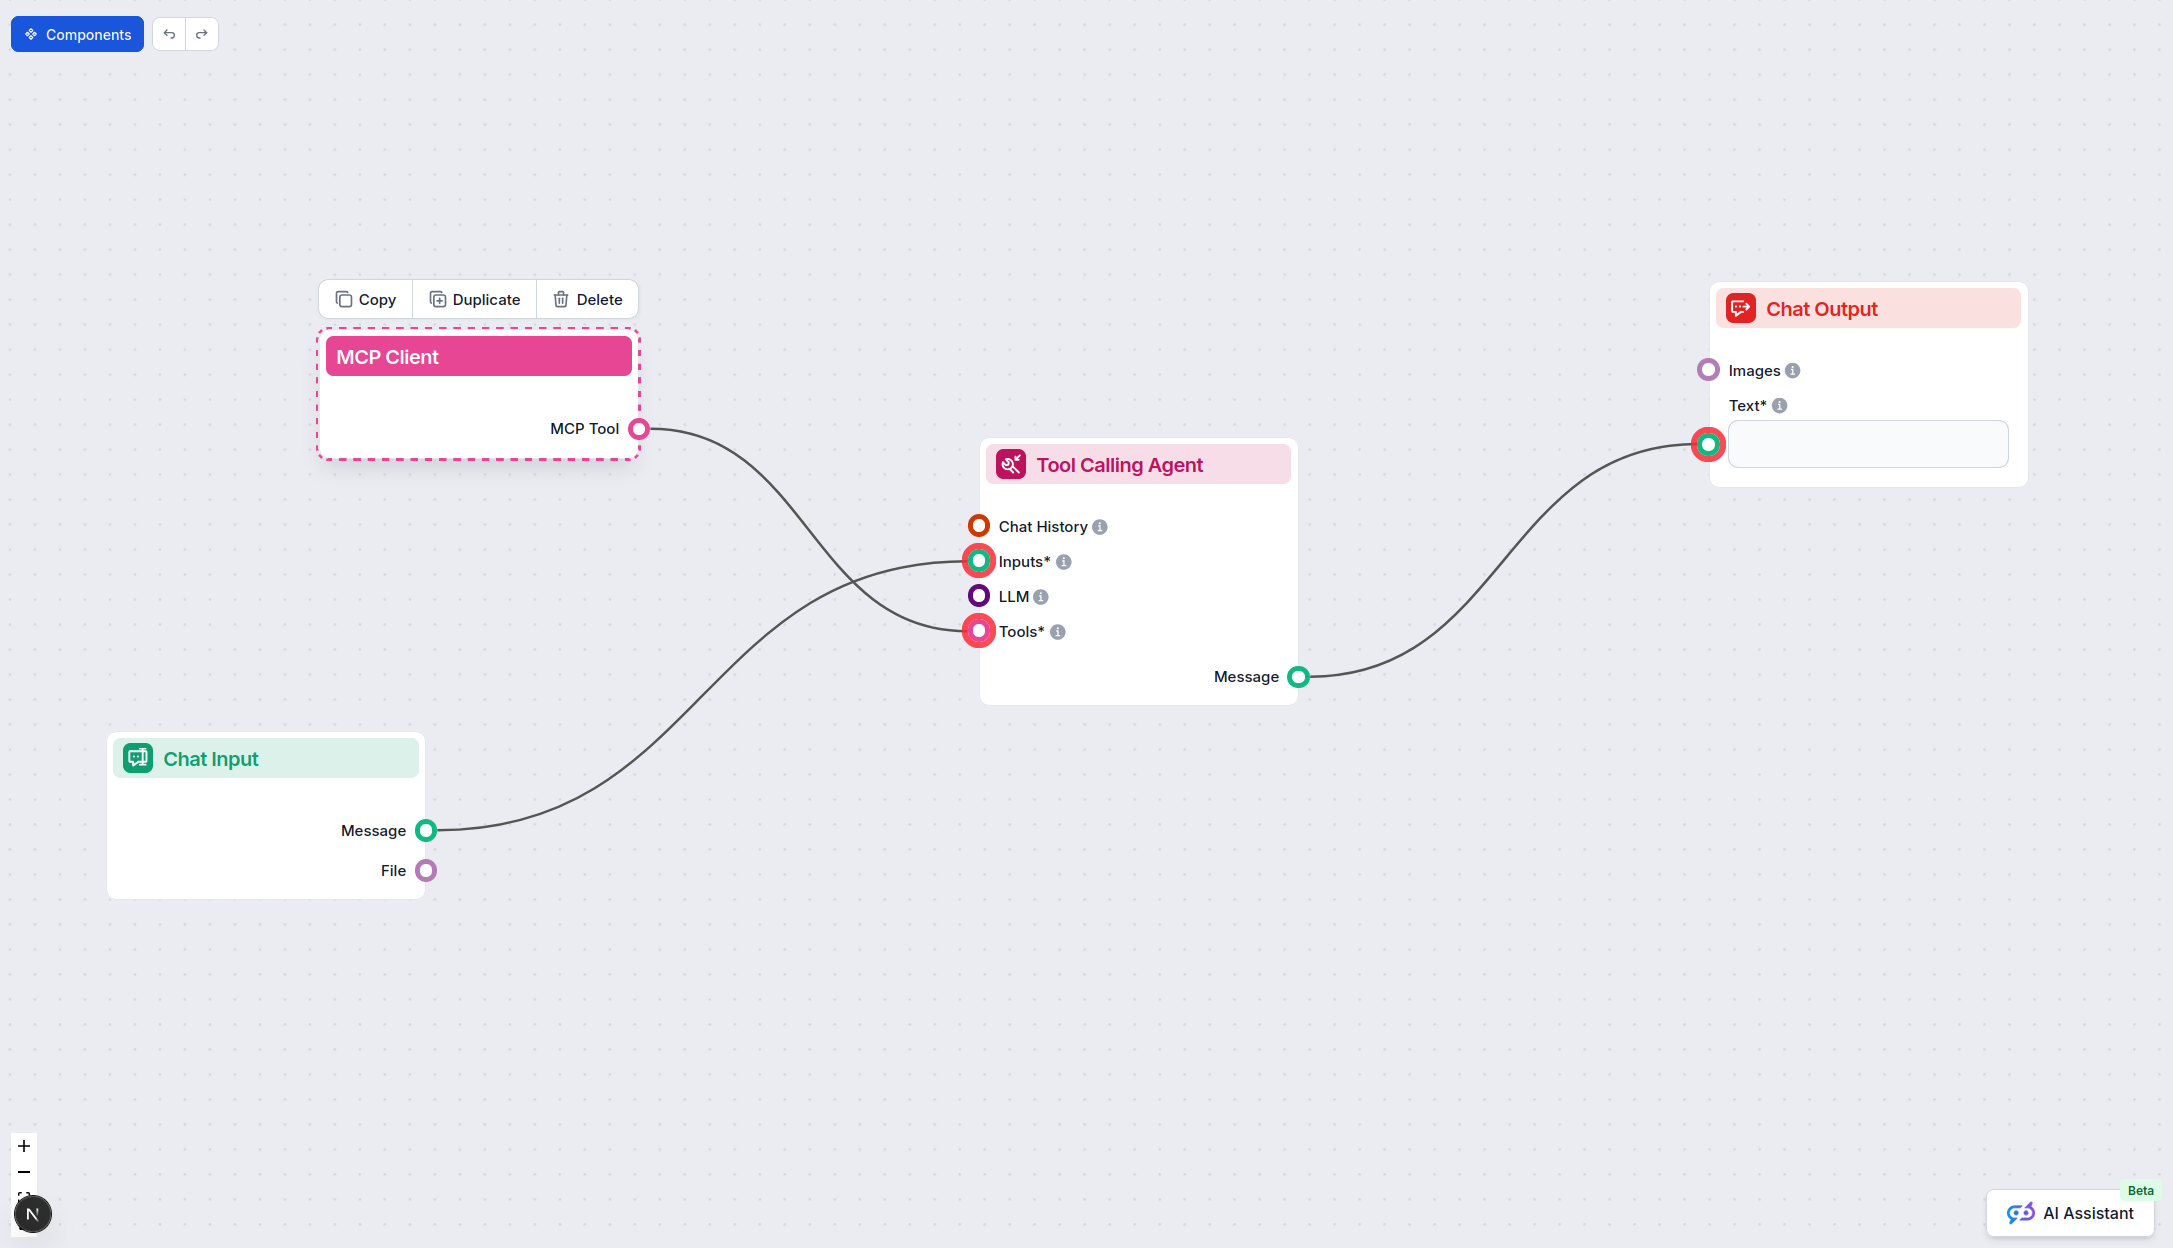
Click on the MCP component to open the configuration panel. In the system MCP configuration section, insert your MCP server details using this JSON format:
{
  "prometheus": {
    "transport": "streamable_http",
    "url": "https://yourmcpserver.example/pathtothemcp/url"
  }
}
Once configured, the AI agent is now able to use this MCP as a tool with access to all its functions and capabilities. Remember to change “prometheus” to whatever the actual name of your MCP server is and replace the URL with your own MCP server URL.
| Section | Availability | Details/Notes |
|---|---|---|
| Overview | ✅ | Prometheus MCP Server enables PromQL queries and analytics |
| List of Prompts | ⛔ | No prompt templates listed |
| List of Resources | ⛔ | No explicit MCP resources described |
| List of Tools | ✅ | PromQL queries, metric listing, metadata, instant/range queries |
| Securing API Keys | ✅ | Environment variable usage detailed |
| Sampling Support (less important in evaluation) | ⛔ | Not specified |
Based on the above, Prometheus MCP Server offers strong tool integration and clear API key security. Some advanced MCP features (like prompts, explicit resources, sampling, and roots) are not documented or implemented.
The Prometheus MCP Server scores well for core MCP tool support and practical integration, but lacks documentation or implementation for prompts, resources, and advanced MCP features. It is reliable for metric analysis but not a full-featured MCP example. Score: 6/10.
| Has a LICENSE | ✅ (MIT) |
|---|---|
| Has at least one tool | ✅ |
| Number of Forks | 22 |
| Number of Stars | 113 |
Empower your AI agents to query, analyze, and automate infrastructure monitoring using the Prometheus MCP Server. Try it in FlowHunt or book a demo to see it in action.
Integrate FlowHunt with Prometheus via the Model Context Protocol (MCP) for secure AI-driven monitoring, automated PromQL querying, and seamless metric analytic...

Integrate and automate Grafana’s dashboards, datasources, and monitoring tools into AI-driven development workflows using FlowHunt's Grafana MCP Server. Enable ...

The Consul MCP Server bridges AI assistants and developer tools with HashiCorp Consul’s powerful service discovery, health checking, and key-value store APIs. T...
Cookie Consent
We use cookies to enhance your browsing experience and analyze our traffic. See our privacy policy.