PowerBI MCP Server
Integrate Microsoft PowerBI with FlowHunt through MCP to manage business intelligence dashboards, data analysis, and reporting workflows seamlessly. Create repo...
5 min read
PowerBI
Business Intelligence
+6
Learn how to integrate FlowHunt with PowerBI, configure observability settings, and visualize your FlowHunt workspace metrics directly in PowerBI dashboards.
As your team scales automations and AI workflows in FlowHunt, visibility into system performance becomes essential.
By connecting your FlowHunt workspace to PowerBI, you can transform your operational data into actionable insights — with dynamic dashboards, reports, and visual analytics.
This article walks you through the new integration flow for connecting FlowHunt to PowerBI and configuring observability — step by step.
By following this guide, you’ll be able to:
Start your free trial today and see results within days.
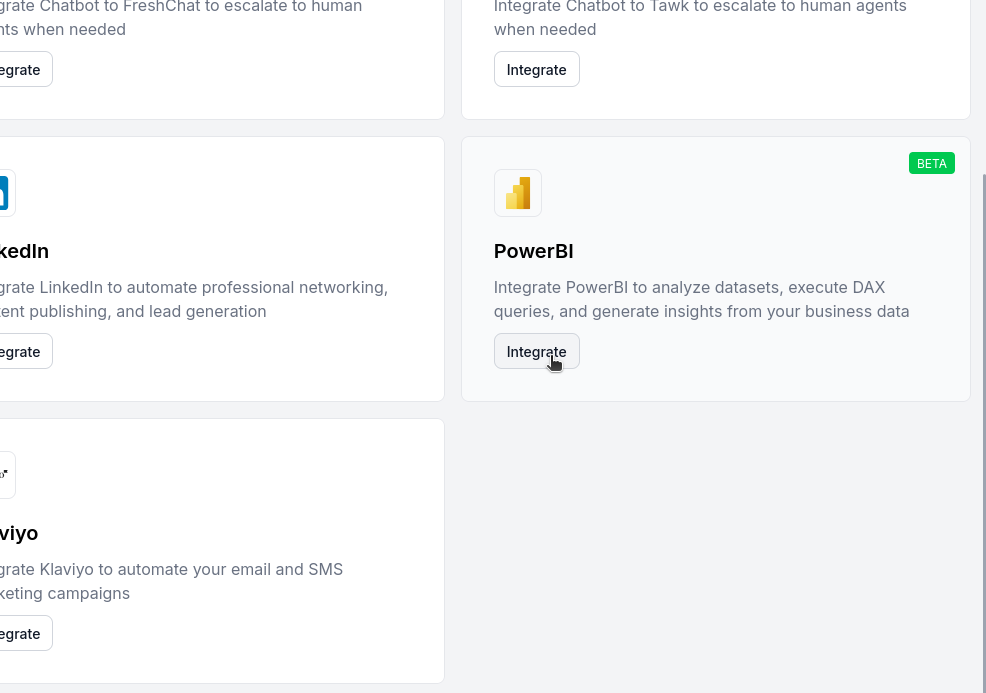
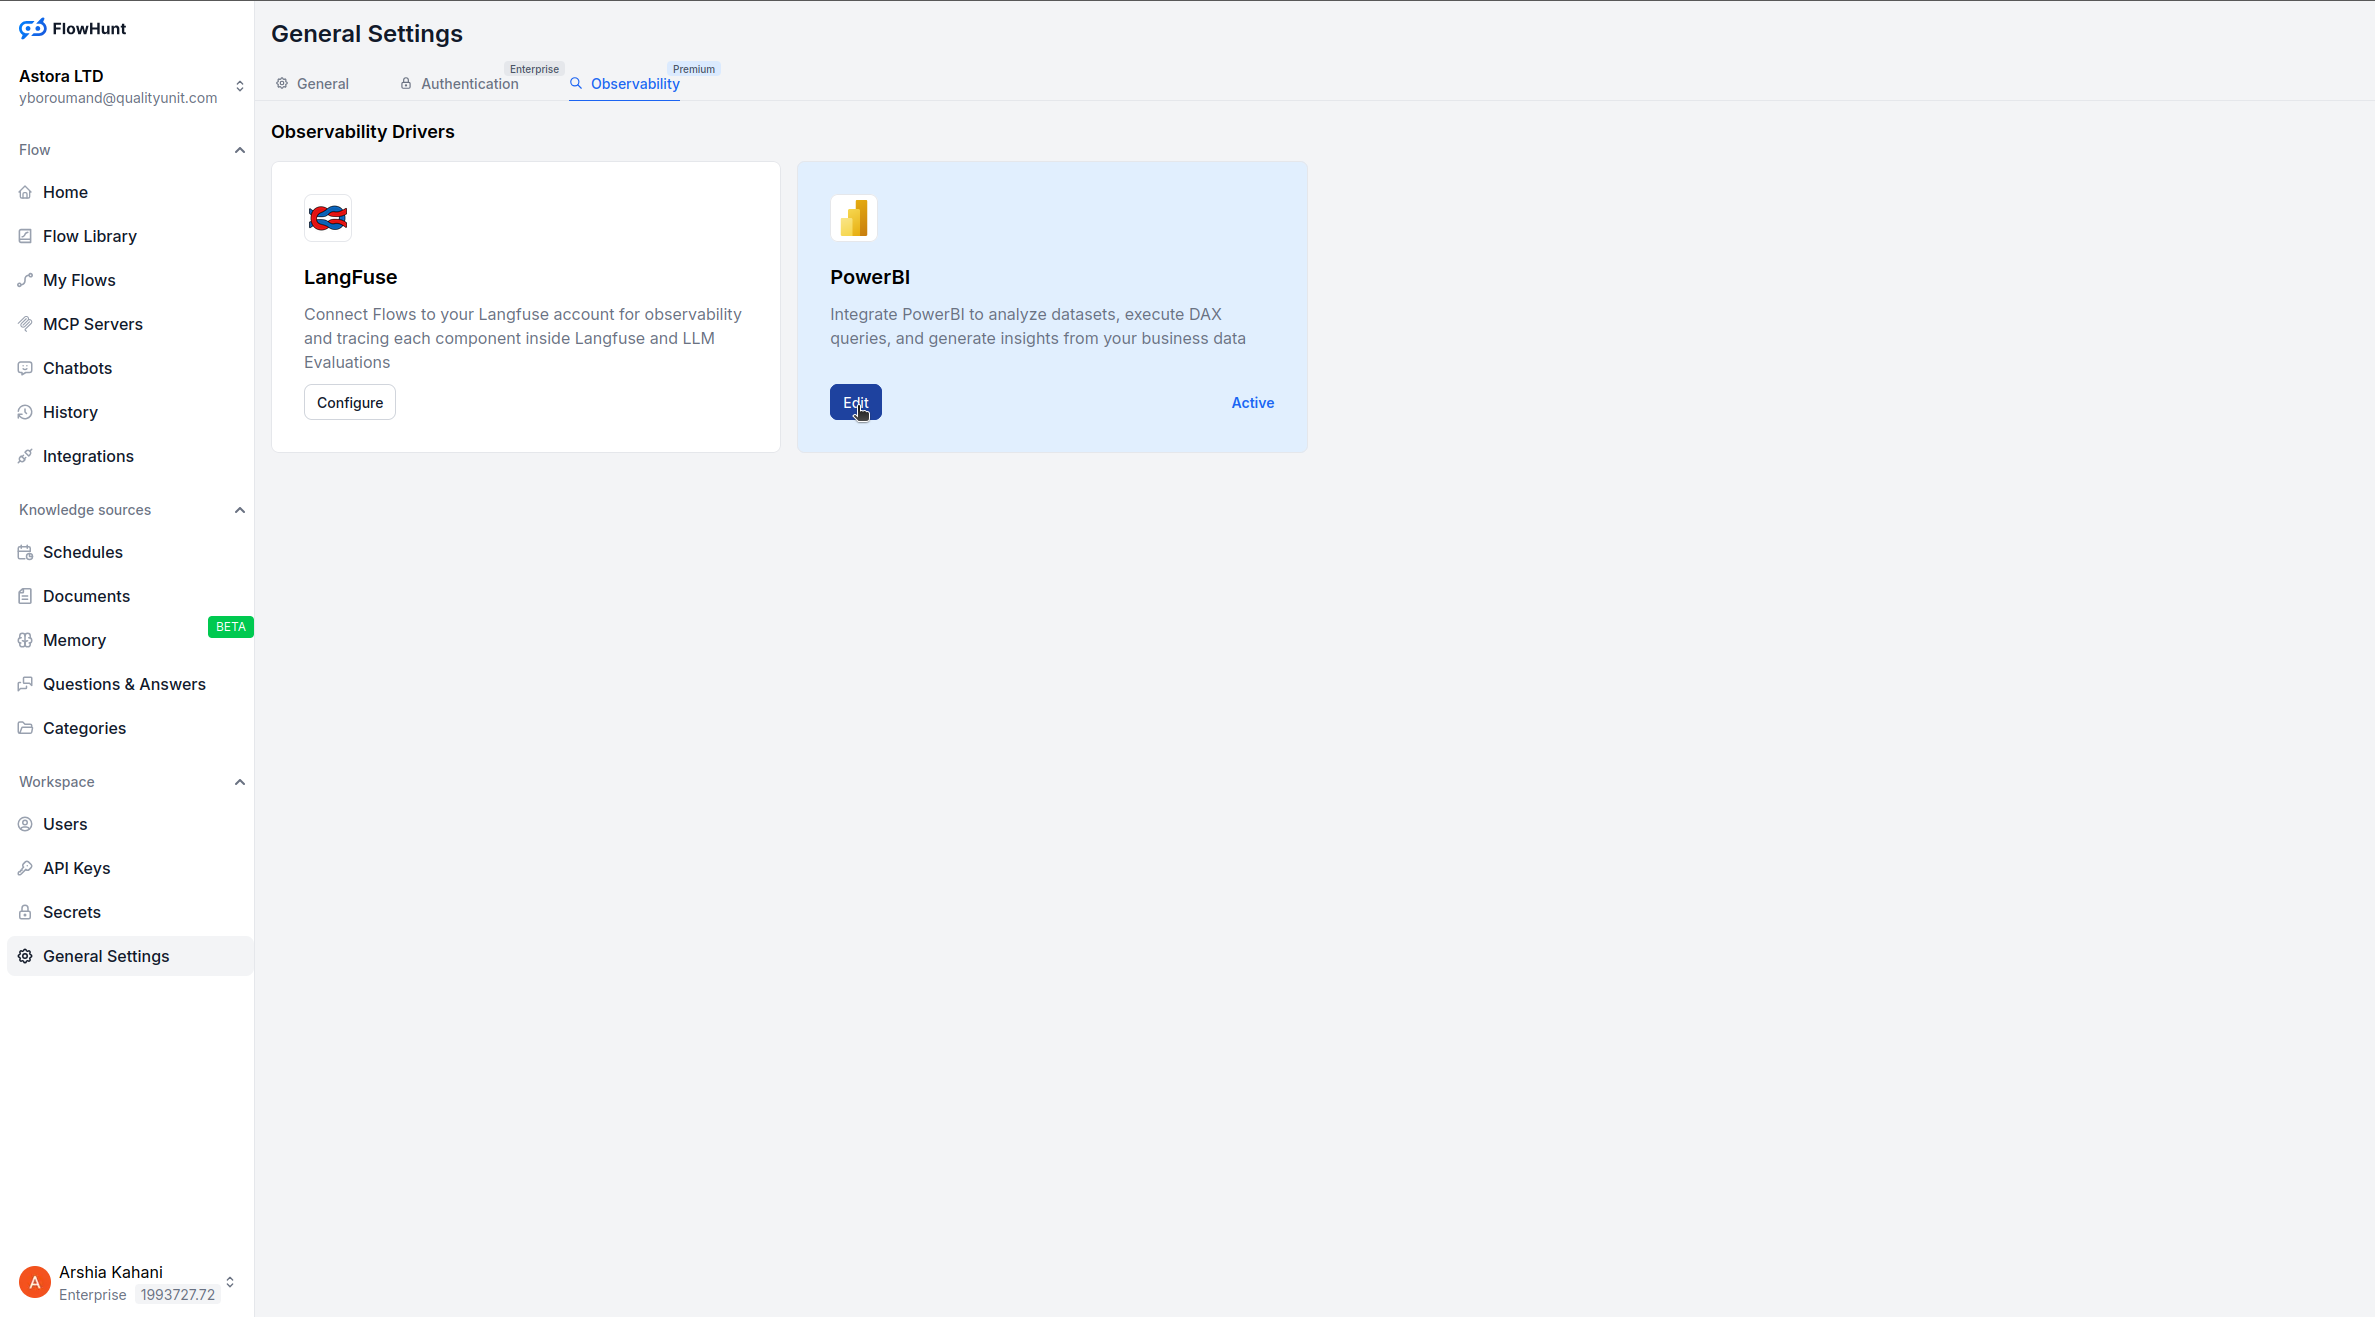
After integration, go to General Settings in your FlowHunt workspace.
Open the Observability section.
Click Configure under the PowerBI option.
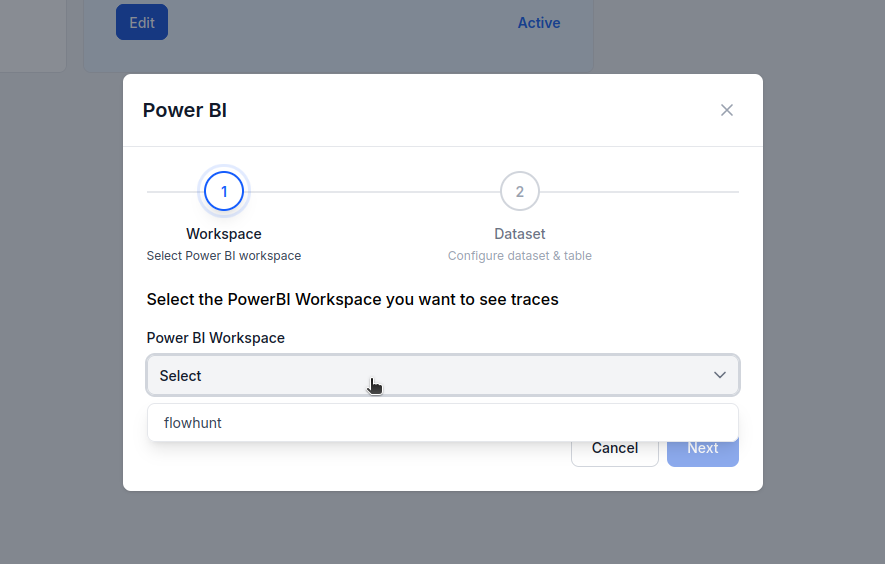
You now have two options:
If you already have an existing dataset connected to PowerBI:
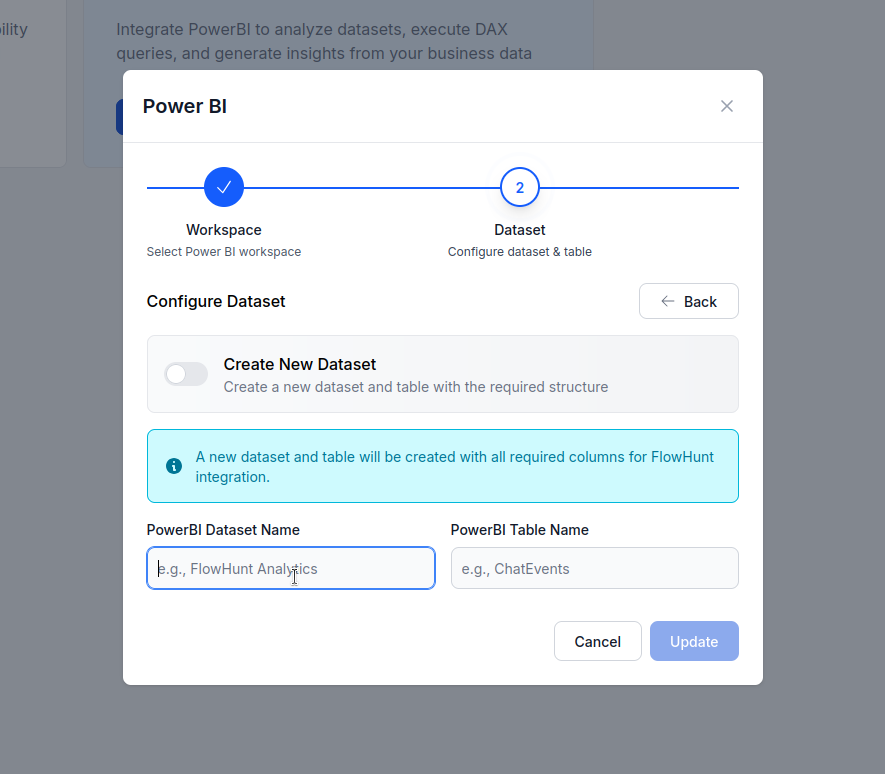
If this is your first setup:
Turn off the “Use Existing Dataset” switch.
Name your new PowerBI dataset and table.
FlowHunt will automatically create them and begin syncing workspace data.
Once configured, FlowHunt begins sending your workspace messages and activity data to the selected PowerBI dataset and table.
From there, you can:
Get latest tips, trends, and deals for free.
With FlowHunt’s new PowerBI integration, connecting your workspace for observability takes just a few clicks — no MCP servers or manual API setup required.
Once integrated, you can instantly visualize performance, monitor automation health, and make data-driven decisions that scale your AI operations.
Integrate Microsoft PowerBI with FlowHunt through MCP to manage business intelligence dashboards, data analysis, and reporting workflows seamlessly. Create repo...

This article explains how to connect FlowHunt with Langfuse for comprehensive observability, trace AI workflow performance, and leverage Langfuse dashboards to ...

Unlock data-driven decision making and operational efficiency with FlowHunt's AI roadmap consulting, predictive analytics solutions, and BI augmentation.
Cookie Consent
We use cookies to enhance your browsing experience and analyze our traffic. See our privacy policy.